Individual and market supply uppose that Sam and Teresa are the only suppliers of ice cream cones in a particular market. The following table shows their monthly supply hedules: Price Sam's Quantity Supplied Teresa's Quantity Supplied (Dollars per cone) (Cones) (Cones) 1 2 4 6 3 6 8 4. 7 10 8 11


Q: Delon’s Department Store sells several of its own brands of clothes and severalwell-known designer…
A: The cost of making and subcontracting will be equivalent to the indifferent volume. They are written…
Q: Carriage and insurance paid to (CIP) are one of the terms of sale is used in place of which of the…
A: Sales is an important and wide section of an organization. It consists of various terminologies such…
Q: Which of the following flows tend to move upstream in a supply chain? Group of answer choices a…
A: The supply chain is the system in which processes, resources, technologies, and employees are used…
Q: hat amount should be reported as inventory at year-end
A: NRV stands for net realizable value which is a valuation method for the inventory in which the value…
Q: Consider the following scenario: Billy's Bikes sold 500 bikes to a customer who wanted the bikes…
A: FOB - FOB stands for free on board which means sellers and buyers are responsible for the product…
Q: Who are the target market of wedding events? 2. What are the availability of the suppliers when it…
A: 1.The main target audience will be the individuals or families involved in the wedding events.
Q: Eagle Electric Repair is a repair facility for several major electric appliance manufacturers. Eagle…
A: Formula:
Q: Whether and why the Reward Plan should be team based or individual based. II. The criteria by which…
A: Here, HACCP stands for - H - hazard A - Analysis C- Critical C- Control P- Points This is used…
Q: Hau Lee Furniture, Inc., spends 50% of its sales dollars in the supply chain and finds its current…
A: Given data; % Sales 140000 100 Cost of material 70000 50 Production cost 28000 20…
Q: One of the best known examples of how an organization can use its supply chain to achieve a…
A: Supply chain management is an important dimension of business because raw materials and resources…
Q: Question 3 - to discuss the appropriate actions the supply chain could take to manage each of these…
A: Organizations may be certain that their plans will be completely realized if they establish the…
Q: A. Formulate and solve a transportation model to determine an optimal monthly ordering and…
A: Algorithm Step2: We have placed the values given and the rest are filled with 999 And also, demand…
Q: Each supplier has a limited capacity in terms of the total number of components it can supply.…
A: Find the Given details below: Given details: Component Supplier 1 2 3 Production plan 1…
Q: Q3 Try to find the initial basic feasible solution from the transportation costs table using Vogel's…
A: A technique for determining the first possible solution to something like a transportation issue.…
Q: Keislss Inc produces refinery glass products and is about to expand its operations in sweden , where…
A: Given: Fixed Cost = $ 9,00,000 Variable cost = $ 92 Unit price = $ 150 Demand = 10,000 units per…
Q: ) What is the bullwhip measure for the retailer? The bullwhip measure for the retailer is ______.…
A: NOTE: We are allowed to do first three sub-parts of a question only. Bullwhip effects starts from…
Q: What types of information should Starwood exchange with its bed linens and terrycloth supplier? What…
A: For the trade between Starwood and its supplier to take place, the company must share some…
Q: H-E-B has once again placed a limit on paper products — some of the most coveted necessities of…
A: It appears that the demand for paper products far exceeds in this economy and to prevent stockouts…
Q: supply chain management Demand Distribution Demand Probability 10 0,01 20 0,03 30 0,05 40 0,08 50…
A: given, product price = $500 cost of product =$300 salvage value of unsold items =$250
Q: John Doe, a procurement manager at That's the Deal Company, has been approached by one of the…
A: Business ethics is a kind of applied ethics, which is used by professionals or researchers to solve…
Q: Friedland Timbers asa Source: Waters, C. D. J. (2019). Logistics: an introduction to supply chain…
A: The logistics costs seem to be rising costs at the same time because the decrease quantity of orders…
Q: Strategic Supply Chain Question (a) What is the bullwhip effect, what are the main causes of the…
A: Supply chain management - is the oversight of the flow of products & services & it…
Q: r. Williams, the leather handbag buyer for an upscale menswear specialty retailer located in San…
A: Given, When Mr. Williams returns to the store, he studies his open-to-buy for this category and…
Q: Acme Inc. has decided to outsource and offshore a small electric motor that it currently…
A: The concept of Operation Management: Operation management is the management that applies to a…
Q: Eagle Electric Repair is a repair facility for several major electric appliance manufacturers. Eagle…
A: Given data is Annual requirement (D) = 100,000 units Working days = 250 days per year
Q: he concept of Supply Chain Management (SCM) emphasizes co-operation and collaboration among the…
A: Supply Chain Management is one of the key topics, trends, and needs in the present business…
Q: Motif is a Turkish electrotechnical company which operates a warehouse in Ankara. The company is…
A: Given Information: Annual Demand (D) = 4000 units Holding cost rate per unit = 1.25 € Holding cost…
Q: 1.What is SCM (Supply Chain Management System)? Explain how SCM works for any business organization
A: A supply chain is a network between manufacturers, suppliers, retailers/wholesalers, and customers.
Q: Question 1. Whether and why the Reward Plan should be team based or individual based. The criteria…
A: Reward system:- The term "reward system" refers to the financial, non-financial, and psychological…
Q: s may use to aid in supply ch
A: The organization can keep its stores loaded and provided through its proficient process for dealing…
Q: A local club is selling Christmas trees and deciding how many to stock for the month of December. If…
A:
Q: A newly built 1000 bedded hospital wants to purchase equipment to the Radiology and Blood bank…
A: Given case: A 1000 bedded hospitals is likely to purchase equipment for the purpose of radiology and…
Q: X Ltd imports and distributes kiddies toys. It most popular item is the Barbie Doll. This costs Rs.…
A: Case 1: when ordered 35000 units Cost = Rs 120 per unit Other expenses(customs and clearing…
Q: Victor Pimentel, purchasing manager of Office Supply Center of Mexico, is searching for a new…
A: This concept is part of the supplier selection method or analysis, where we choose suppliers on the…
Q: 1. Determine the inventory order quantity for Diamant’s distributor. 2. Compare the optimal order…
A: 2) The economic order quantity is the optimal order quantity that would minimize the overall holding…
Q: Demand curve would shift to the right, shift to the left or movement along the demand/supply curve
A: The demand curve generally shifts towards the right if the demand increases and if the demand…
Q: What is the bullwhip measure for the retailer? The bullwhip measure for the retailer is ________.…
A: NOTE: We are allowed to do first three subparts of a question only. Bullwhip effect occurs due to…
Q: Tommy's Family Furniture is looking for a new supplier for its armchairs. Tommy is primarily…
A: Given data Tommy has two supplier choices for a new arm chair On a 10-point scale, Amy's Armchairs…
Q: cenario One: An 86-year widow comes in monthly to have her blood drawn and monitored ever since her…
A: Operations management at front desk involves customer satisfaction but upholding the business…
Q: A company's distribution and warehouse expenses do NOT include which one of the following? a) The…
A: For any organization, it is important to monitor the expenses associated with its distribution and…
Q: You have been asked to analyze the bids for 200 polished disks used in solar panels. These bids have…
A: A bid is described as an offer that is made by any firm or an individual during a purchase of an…
Q: Eight Flags operates several amusement parks in the Midwest. The company stocks machine oil to…
A: Given data:
Q: that adoption of a modern Enterprise resource planning software such as Microsoft Navision would…
A: Flexible deployment choices, increased security and privacy, long-term viability, and low-code…
Q: Eight Flags operates several amusement parks in the Midwest. The company stocks machine oil to…
A: Shipping cost is the cost or expense used for shipping the items or quantity of the product to the…
Q: Can you think of other attributes that might be associated with SUPPLY SCHEDULE?
A: Supply management manages the flow of goods and services from the movement of raw material to…
Q: Describe how the suppliers using a factor weighting appraoch
A: This technique combines more authentic news sources, and analysis generates a composite reward for…
Q: A firm’s cost of goods sold last year was $3,410,000, and the firm operates 52 weeks per year. It…
A:
Please give a detailed solution with an explanation with a typed answer. For the graph make sure it is readable, visible, and label each of the x and y points/coordinates as well for both lines.
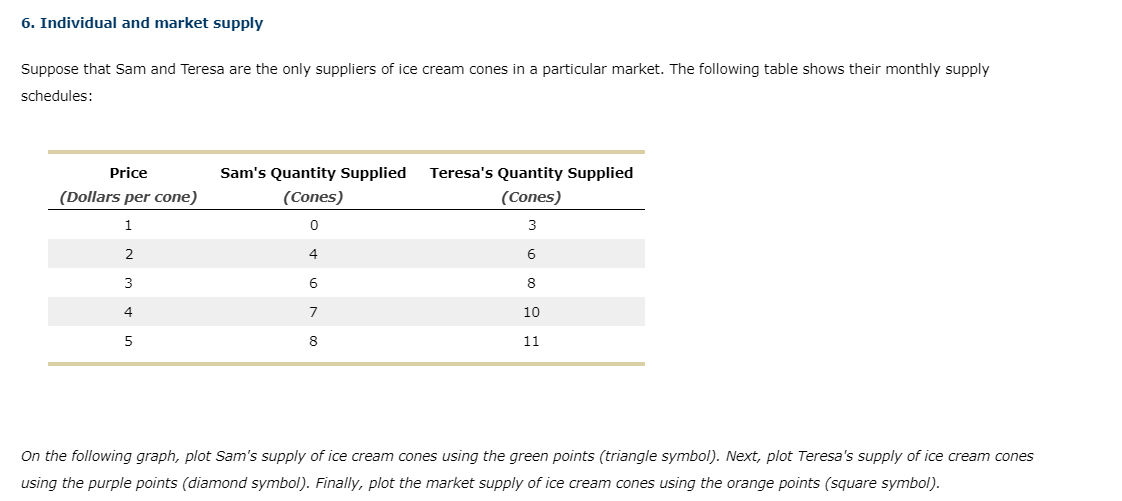
Market supply = Teresa's supply + Sam's supply
Market supply schedule is as follows.
| Price | Sam's Supply | Teresa's Supply | Market supply |
| 1 | 0 | 3 | 3 |
| 2 | 4 | 6 | 10 |
| 3 | 6 | 8 | 14 |
| 4 | 7 | 10 | 17 |
| 5 | 8 | 11 | 19 |

Step by step
Solved in 2 steps with 1 images


- Consider a three-firm supply chain consisting of a retailer, manufacturer, and supplier. The retailer's demand over an 8-week period was 110 units each of the first 2 weeks, 190 units each of the second 2 weeks, 310 units each of the third 2 weeks, and 400 units each of the fourth 2 weeks. The following table presents the orders placed by each firm in the supply chain. Notice, as is often the case in supply chains due to economies of scale, that total units are the same in each case, but firms further up the supply chain (away from the retailer) place larger, lessfrequent, orders. WEEK RETAILER MANUFACTURER SUPPLIER 1 110 220 600 2 110 3 190 380 4 190 5 310 620 1420 6 310 7 400 800 8 400 a) What is the bullwhip measure for the retailer? The bullwhip measure for the retailer is ______. (Enter your response rounded to two decimal places.) b) What is the bullwhip measure for the manufacturer? The bullwhip measure for the…Consider a supply chain with a manufacturer (M) and a retailer (R). The manufacturer produces a product A at a cost of c = $50. The manufacturer offers the product to the retailer at a wholesale price of w = $70, and fixes the sale price to p = $90. The market demand is normally distributed with mean of 10,000 units and standard deviation of 1000. Answer the following questions: a. What is the optimal order quantity for the retailer? b. What is the optimal order quantity if the wholesale price is changed to $60? Does the optimal order quantity increase or decrease compared to 1a? Why? c. What is the optimal order quantity if the wholesale price is changed to $80? Does the optimal order quantity increase and decrease compared to 1a? Why? d. If the actual market demand is equal to the mean demand, then what are the profits of the manufacturer and the retailer?A global sourcing manager for Delta Automotive wants to compute the total supply chain costs for automobile parts purchased from three different global suppliers. The data related to the supply chain costs associated with three possible suppliers has been collected in the Microsoft Excel Online file below.The annual demand D is 450,000 units. The supplier prices and transportation costs are predicated on an order quantity of 45,000 units (note that this is not the EOQ.) We may assume that parts are transported from Mexico to the United States by truck, and by a combination of ships and trucks from Japan and China, and 250 working days per year. Open the spreadsheet and perform the required analysis to answer the questions below. Questions 1. What are the total supply chain cost for each of the suppliers? Round your answers to the nearest dollar. Japanese Mexican Chinese Supplier Supplier Supplier Total
- A global sourcing manager for Delta Automotive wants to compute the total supply chain costs for automobile parts purchased from three different global suppliers. The data related to the supply chain costs associated with three possible suppliers has been collected in the Microsoft Excel Online file below.The annual demand D is 450,000 units. The supplier prices and transportation costs are predicated on an order quantity of 45,000 units (note that this is not the EOQ.) We may assume that parts are transported from Mexico to the United States by truck, and by a combination of ships and trucks from Japan and China, and 250 working days per year. Open the spreadsheet and perform the required analysis to answer the questions below. Questions 1. What are the total supply chain cost for each of the suppliers? Round your answers to the nearest dollar.(A). On the first graph that follows, show the effect of a shift of the entire supply curve resulting from suppliers producing more peanut butter at every given price. (first graph has no square on it) Note: Select and drag the curve to the desired position. The curve will snap into position, so if you try to move the curve and it snaps back to its original position, just drag it a little farther. (B). On the next graph, show the effect of a movement along a fixed supply curve that results from an increase in the price of peanut butter, with every other factor held constant. (second graph has square on it) (C). Complete the following table by indicating whether each event will cause a movement along the supply curve for wheat or a shift of the supply curve for wheat, holding all else constant. An increase in the price of straw, a good produced from the same inputs and in the same industry as wheat Movement Along or Shift? An increase in the price of wheat Movement Along…Assume that Trinbago is a small country that produces wine and motor vehicles, where motor vehicles are capital intensive. Trinbago is also capital intensive, and the standard Heckscher -Ohlin H-O) assumptions hold. The other country in the model is Vincyland. Questions: (c) In autarky, according to Ohlin, how does Trinbago’s relative price of labour compare to Vincyland’s? (d) Show the necessary graphs to fully explain all requested effects. Ensure to label graphs and give brief explanations.
- The government of Australia has embarked on various policies such as Job Keeperand the provision of subsidies to firms in order to reduce the severity of COVID 19 on theeconomy. Suppose the money supply expands such that the Reserve Bank predictsthat the economic expansion is not sustainable.Use two diagrams one for the money market and another for the goods and services(Aggregate Demand and Aggregate Supply model), to explain the policy that theReserve Bank can adopt in order to overcome the effect of increasing the money supplyon the economy.Assume that: the money supply increased from the equilibrium of AUD 40 billion to AUD 70billion Interest was reduced to the interest rate of 1.5% as part of the stimulus packagefor the nation to overcome the effects of COVID 19. But the equilibrium interestrate is 4% Assume that equilibrium real GDP is AUD 60 billion Assume that inflation during the COVID crisis was at an equilibrium price of CPI 65 Assume that to overcome the inflationary…A company can purchase component H from 3 potential suppliers. Supplier A charges a fee of $5.50 per component. Supplier B charges $1500 per order plus $2.00 per component ordered. Supplier C charges $4.00 per component, and requires the buyerto pay for at least 280 components (even if the order size is less than 280). ANSWER THE FOLLOWING QUESTIONS: 4) What is the full range of order sizes where each supplier is optimal?5) The company decided to buy 300 units of component H from supplier A. How much money could the company have saved if it purchased the 300 units from supplier C instead of supplier A?6) Next week supplier B will be running a 10% off special. If the company needs to purchase 600 units of component H during the special, which supplier should be chosen?TJ, Inc. makes three nut mixes for sale to grocery chains located in the Southeast. The three mixes, referred to as the Regular Mix, the Deluxe Mix, and the Holiday Mix, are made by mixing different percentages of five types of nuts. In preparation for the fall season, TJ, Inc. just purchased the following shipments of nuts at the prices shown: Type of Nut Shipment Amount (pounds) Cost per Shipment ($) Almond 6,200 7,500 Brazil 7,600 7,225 Filbert 7,600 6,750 Pecan 6,000 7,300 Walnut 7,600 7,875 The Regular Mix consists of 15% almonds, 25% Brazil nuts, 25% filberts, 10% pecans, and 25% walnuts. The Deluxe Mix consists of 20% of each type of nut, and the Holiday Mix consists of 25% almonds, 15% Brazil nuts, 15% filberts, 25% pecans, and 20% walnuts. An accountant at TJ, Inc. analyzed the cost of packaging materials, sales price per pound, and so forth, and determined that the profit contribution per pound is $1.70 for the Regular Mix, $2.05 for the Deluxe Mix, and $2.30…
- TJ, Inc. makes three nut mixes for sale to grocery chains located in the Southeast. The three mixes, referred to as the Regular Mix, the Deluxe Mix, and the Holiday Mix, are made by mixing different percentages of five types of nuts. In preparation for the fall season, TJ, Inc. just purchased the following shipments of nuts at the prices shown: Type of Nut Shipment Amount (pounds) Cost per Shipment ($) Almond 6,200 7,500 Brazil 7,600 7,225 Filbert 7,600 6,750 Pecan 6,000 7,300 Walnut 7,400 7,875 The Regular Mix consists of 15% almonds, 25% Brazil nuts, 25% filberts, 10% pecans, and 25% walnuts. The Deluxe Mix consists of 20% of each type of nut, and the Holiday Mix consists of 25% almonds, 15% Brazil nuts, 15% filberts, 25% pecans, and 20% walnuts. An accountant at TJ, Inc. analyzed the cost of packaging materials, sales price per pound, and so forth, and determined that the profit contribution per pound is $1.60 for the Regular Mix, $2.05 for the Deluxe Mix, and $2.20…Shaftel Ready Mix is a processor and supplier of concrete, aggregate, and rock products. One division of the company operates in the intermountain western United States. Currently, Shaftel has 14 cement-processing plants and a labour force of more than 375 employees. With the exception of cement powder, all raw materials (for example, aggregates and sand) are produced internally by the company. U.S. demand for concrete and aggregates has been growing steadily, and in the west, the growth rate has been above the national average. Because of this growth, Shaftel has more than tripled its gross revenues over the past 10 years. Of the intermountain states, Arizona has been experiencing the most growth. Processing plants have been added over the past several years, and the company is considering the addition of yet another plan (to be located in Scottsdale). A major advantage of having another plan in Arizona is the ability to operate year-round, a feature not found in such states…1. Evaluate the current China/Taiwan logistics costs. Assume a current total volume of 190,000CBM and that 89 percent is shipped direct from the supplier plants in containers. Use the datafrom the case and assume that the supplier-loaded containers are 85 percent full. Assume thatconsolidation centers are run at each of the four port locations. The consolidation centers useonly 40-foot containers and fill them to 96 percent capacity. Assume that it costs $480 to ship a20-foot container and $600 to ship a 40-foot container. What is the total cost to get thecontainers to the United States? Do not include U.S. port costs in this part of the analysis.2. Evaluate an alternative that involves consolidating all 20-foot container volumes and using onlya single consolidation center in Shanghai/Ningbo. Assume that all the existing 20-foot containerUU- SCM-1200 Introduction to Supply Chain Management Page 2volumes and the existing consolidation center volumes are sent to this single…