Inserting charts in MS Excel 3. Create the following worksheet and create following charts. A1 fe Month B E Dolphins Whales 1 Month 2 Jan 3 Feb 4 Mar 5 Apr 6 May Bears 80 54 8 150 54 77 93 32 100 116 11 76 137 6. 93 7 Jun 184 72 | 10 i. Pie-in 3D chart ii. Clustered Pyramid chart Stacked Line chart iii.
Inserting charts in MS Excel 3. Create the following worksheet and create following charts. A1 fe Month B E Dolphins Whales 1 Month 2 Jan 3 Feb 4 Mar 5 Apr 6 May Bears 80 54 8 150 54 77 93 32 100 116 11 76 137 6. 93 7 Jun 184 72 | 10 i. Pie-in 3D chart ii. Clustered Pyramid chart Stacked Line chart iii.

Chapter5: Data Manipulation And Transaction Control
Section: Chapter Questions
Problem 6HOA

Related questions
Question
100%
Transcribed Image Text:Output:
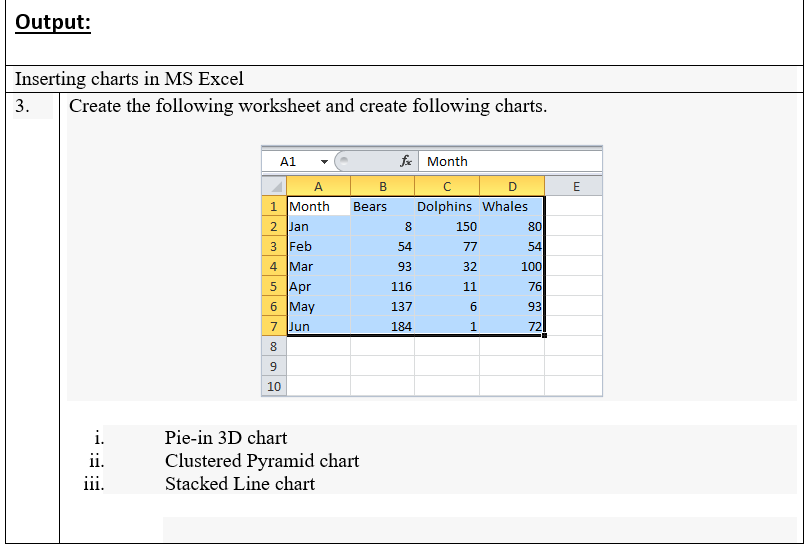
Inserting charts in MS Excel
Create the following worksheet and create following charts.
3.
A1
fe Month
A
B
D
E
1 Month
Bears
Dolphins Whales
2 Jan
3 Feb
150
80
54
77
54
4 Mar
5 Apr
6 May
7 Jun
93
32
100
116
11
76
137
93
184
1.
72
8.
10
Pie-in 3D chart
ii.
Clustered Pyramid chart
Stacked Line chart
iii.
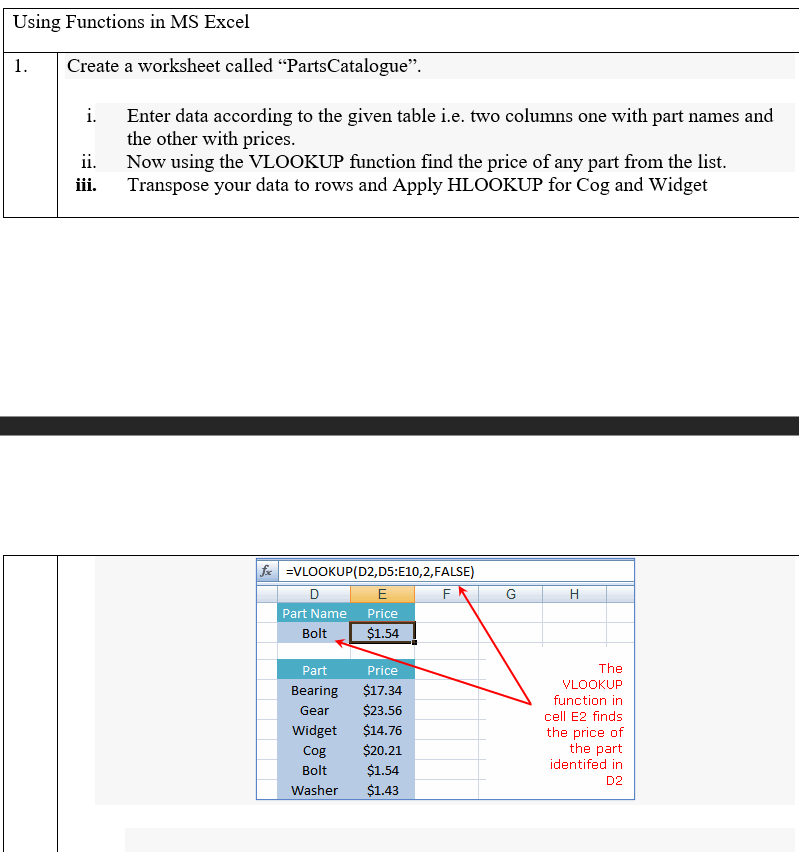
Transcribed Image Text:Using Functions in MS Excel
1.
Create a worksheet called "PartsCatalogue".
i. Enter data according to the given table i.e. two columns one with part names and
the other with prices.
Now using the VLOOKUP function find the price of any part from the list.
Transpose your data to rows and Apply HLOOKUP for Cog and Widget
ii.
iii.
fe =VLOOKUP(D2,D5:E10,2,FALSE)
E
H
Part Name Price
$1.54
Bolt
Part
Price
The
VLOOKUP
Bearing
$17.34
function in
Gear
$23.56
cell E2 finds
Widget
$14.76
the price of
the part
identifed in
Cog
$20.21
Bolt
$1.54
D2
Washer
$1.43
Expert Solution
This question has been solved!
Explore an expertly crafted, step-by-step solution for a thorough understanding of key concepts.

This is a popular solution!

Trending now
This is a popular solution!

Step by step
Solved in 4 steps with 3 images

Knowledge Booster


Learn more about
Need a deep-dive on the concept behind this application? Look no further. Learn more about this topic, computer-science and related others by exploring similar questions and additional content below.Recommended textbooks for you