Instruction: Analyze/Interpret the results. Organize your discussion in paragraph form. Father's Age * Sex of the Baby
Instruction: Analyze/Interpret the results. Organize your discussion in paragraph form. Father's Age * Sex of the Baby

Glencoe Algebra 1, Student Edition, 9780079039897, 0079039898, 2018
18th Edition
ISBN:9780079039897
Author:Carter
Publisher:Carter
Chapter10: Statistics
Section10.4: Distributions Of Data
Problem 19PFA

Related questions
Question
Instruction:
Analyze/Interpret the results. Organize your discussion in paragraph form.
Father's Age * Sex of the Baby
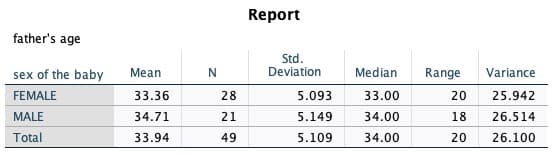
Transcribed Image Text:Report
father's age
Std.
Deviation
sex of the baby
Mean
Median
Range
Variance
FEMALE
33.36
28
5.093
33.00
20
25.942
MALE
34.71
21
5.149
34.00
18
26.514
Total
33.94
49
5.109
34.00
20
26.100
Expert Solution
This question has been solved!
Explore an expertly crafted, step-by-step solution for a thorough understanding of key concepts.

Step by step
Solved in 2 steps

Recommended textbooks for you
Glencoe Algebra 1, Student Edition, 9780079039897…
Algebra
ISBN:
9780079039897
Author:
Carter
Publisher:
McGraw Hill
Glencoe Algebra 1, Student Edition, 9780079039897…
Algebra
ISBN:
9780079039897
Author:
Carter
Publisher:
McGraw Hill