Interpret the slope in this model


Q: Find the slope of line BC.
A:
Q: What is the slope of the line given below? O slope=1 O slope = 4 O slope= O slope = 2
A: Given that, The graph of a function is given and we have to find the slope of the euation of graph.
Q: (-16,-8) (-15,-18) find the slope please show the work.
A:
Q: Use a geoboard to model slope Question What is the slope of the line on the geoboard shown? Provide…
A: according to definition of the slope in geoboard.
Q: (6,-2), (3,-12) find the slope, show the work
A: The formula of the slope is given as, m=y2-y1x2-x1 where x1,y1 are the coordinates of the first…
Q: Suppose you purchase a house for $753,000 and the value of the house increases by $5000 per year…
A:
Q: To estimate ages of trees, forest rangers use a linear model that relates tree diameter, d (in…
A: Given equation is a linear equation in standard form y=mx+c So, by comparing A=6.45 d - 0.15 with…
Q: The horsepower produced by an automobile engine was recorded for various engine speeds in the range…
A: The slope of a linear function slope y=mx+bis the rate at which y is changing per unit of change in…
Q: The ladder of a straight slide in a playground is 6 feet high. The distance along the ground from…
A: Let's draw above scenario: AB is the length of the ladder as straight slide BC is the distance…
Q: Find the slope of a roof that rises 4 feet vertically over a horizontal distance of 6 feet.
A: Find the slope of a roof that rises 4 feet vertically over a horizontal distance of 6 feet.
Q: At sea level, the weight of the atmosphere exerts a pressure of 14.7 pounds per square inch,…
A: topic- linear equations
Q: Ramp 12
A:
Q: Please solve and show your work
A: Given points are (1, –1) and (–9, –4).Slope m of a non-vertical line that passes through two points
Q: Find the equation of the line using the given information. The slope equals zero and it passes…
A:
Q: Calculate the slope of each side
A: We are given with the graph and need to find the slope
Q: Consider the line shown on the graph Enter the equation of the line in form y = Mx + B where m is…
A: Solve the following
Q: Identify the slope and y-intercept from the graph. Slope = %3D y-intercept: %3D 2.
A: NOTE: Refresh your page if you can't see any equations. . two points are ................the…
Q: Write the equation of the line in fully simplified slope
A:
Q: What is the slope
A: slope of the line passing through two points is m = Y2-Y1X2-X1 detailed solution is given below
Q: Write what you know about slope and draw the four different types of slope.
A:
Q: The pitch of a roof is its slope. Find the pitch of the roof shown.
A: We have to find pitch of the roof. Given, Pitch of a roof = slope And we know that Slope = tanA…
Q: uoter ow' mucn worK iS reauired to raise Slope
A: Initial mass, M0 = Mass of the bucket + mass of the water = 1 + 3 = 4 kgWater leaks at a constant…
Q: Part 1: Identify if the slope is positive, negative, zero or unidentified
A:
Q: a) Find the slope of the line seg
A:
Q: Wete an equation in glope itercapt form for the line with slope 8 and y-ntercept-8. Then graph the…
A:
Q: a) How far does David travel per revolution? I feet (b) What is the slope of the graph?
A: Explanation and solutions is given below.....
Q: Use the slope formula to determine the slope of the line that passes through the points (-5, –3) and…
A: Answer is given below
Q: What is the slope of the line given below? slope= 1
A: solution:-according to the given graph of the line.points on the linex1, y1=2, 0x2 , y2=0, 4
Q: Determine whether the statement is true or false. If it is false, explain why or give an example…
A: Given: If a line contains points in both the first and third quadrants, then its slope must be…
Q: Write the point slope form of the equation of the line through the given point with the given slope
A:
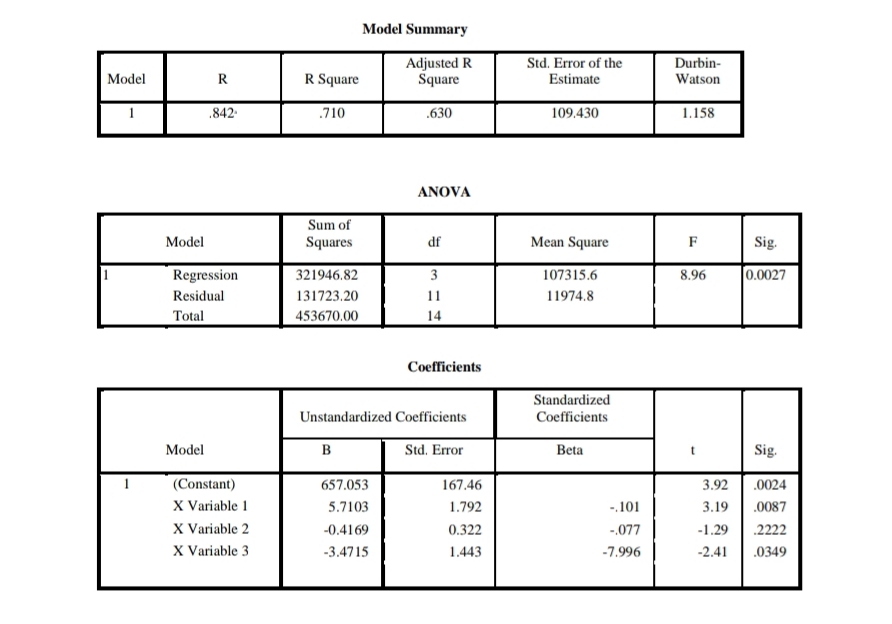
Q: nterpret the slope in this model
A: There are three independent variables X1, X2, X3 General form of multiple regression is given by the…
Q: Topic B: Finding Slope Between Two Points Calculate the slope between the two points. 5. (1, 2) and…
A:
Q: and use to represent slope. * You should always write slope as a
A: Slope of a line is a number that represent the direction and the steepness of the line.
Q: Write the equation for the given graph. Point Slope Form
A: We are given with the graph and need to find the equation of the line.
Q: culate the slope of the line on the graph show
A: To the slope of the line on the graph shown below.
Q: Problem What is the slope of the graphed line?
A:
Q: (a) Find the slope of the graph of c. What does it represent? (b) What is the dosage for a newborn?
A:
Q: Give the slope and y-intercept of the line. [?] slope = , y-intercept = [] %3D %3D
A: Given, The graph of the straight line We have to find the slope and y-intercept of the line.
Q: Parallel lines have the same slope.
A:
Q: The estimated equation is? Interpret the intercept.? Interpret the slope coefficient.?
A: Hello. Since your question has multiple sub-parts, we will solve first three sub-parts for you. If…
Q: A researcher for an environmental agency is investigating fuel economy. She has developed a linear…
A:
Q: Find the slope andintercept of the line and write the equation. Show your work.
A: From the graph At x = 0 , we have y = 4 So the y intercept is c = 4
Q: Model the slope m=6/5 using a geoboard.
A: Given : Slope (m) = 6/5 Model using Geoboard
Q: What is the slope of a road that rises 6 feet for every horizontal change of 100 feet? 6. 50 1 100…
A:
Q: What is the slope of the line shown? Write the slope in simplest form. Om = Om=극 m = } Om={
A: Since you have asked multiple questions in a single request, we will be answering only the 1st…
Q: Line with slope m through (a, b ).
A:
Q: ork
A: we have to determine the slope.

Interpret the slope in this model.

Step by step
Solved in 2 steps


- In a bivariate regression, the variable from which a prediction is made is called the predictor variable, whereas the variable to be predicted or (the outcome) is called the: Group of answer choices predictor variable. criterion variable. coefficient variable. covariate variable.Consider a linear regression model that relates school expenditures and family background to student performance in Massachusetts using 224 school districts. The response variable is the mean score on the MCAS (Massachusetts Comprehensive Assessment System) exam given in May 1998 to 10th-graders. Four explanatory variables are used: (1) STR is the student-to-teacher ratio, (2) TSAL is the average teacher’s salary, (3) INC is the median household income, and (4) SGL is the percentage of single family households. The Excel Regression output for the sample regression equation is given below. (a) What proportion of the variation in MCAS score is explained by the explanatory variables? (b) At the 5% level, are the explanatory variables jointly significant in explaining MCAS score? Explain briefly. (c) At the 5% level, which variables are individually significant at predicting MCAS score? Explain briefly. (d) Suppose a second regression model (Model 2) was generated using only…Consider a linear regression model that relates school expenditures and family background to student performance in Massachusetts using 224 school districts. The response variable is the mean score on the MCAS (Massachusetts Comprehensive Assessment System) exam given in May 1998 to 10th-graders. Four explanatory variables are used: (1) STR is the student-to-teacher ratio, (2) TSAL is the average teacher’s salary, (3) INC is the median household income, and (4) SGL is the percentage of single family households. The Excel Regression output for the sample regression equation is given below. (a) What proportion of the variation in MCAS score is explained by the explanatory variables? (b) At the 5% level, are the explanatory variables jointly significant in explaining MCAS score? Explain briefly. (c) At the 5% level, which variables are individually significant at predicting MCAS score? Explain briefly. (d) Suppose a second regression model (Model 2) was generated using only…
- A group of educators want to determine how effective tutoring is in raising students' grades in a math class, so they arrange free tutoring for those who want it. Then they compare final exam grades for the group that took advantage of the tutoring and the group that did not. Suppose the group participating in the tutoring tended to receive higher grades on the exam. Does that show that the tutoring worked? If not, explain why not and suggest a confounding variable. Question content area bottom Part 1 Choose the correct answer below. A. Because this was an observational study, it only shows an association; it does not show that the tutoring worked. It could be that an insufficient number of students were studied to show that the tutoring worked. B. The study shows that the tutoring worked. C. Because this was an observational study, it only shows an association; it does not show that the tutoring worked. It could be that more motivated…a. Develop an estimated regression equation that can be used to predict annual sales given the years of experience. Use the excel regression tool. b. Use the estimated regression equation to predict annual sales for a salesperson with 9 years of experience. Provide an approximate 95% confidence interval.In a study of housing demand, the county assessor develops the following regression model to estimate the market value (i.e., selling price) of residential property within his jurisdiction. The assessor suspects that important variables affecting selling price (YY, measured in thousands of dollars) are the size of a house (X1X1, measured in hundreds of square feet), the total number of rooms (X2X2), age (X3X3), and whether or not the house has an attached garage (X4X4, No=0, Yes=1No=0, Yes=1). Y=α+β1X1+β2X2+β3X3+β4X4+εY=α+β1X1+β2X2+β3X3+β4X4+ε Now suppose that the estimate of the model produces following results: a=166.048a=166.048, b1=3.459b1=3.459, b2=8.015b2=8.015, b3=−0.319b3=−0.319, b4=1.186b4=1.186, sb1=1.079sb1=1.079, sb2=5.288sb2=5.288, sb3=0.789sb3=0.789, sb4=12.252sb4=12.252, R2=0.838R2=0.838, F-statistic=12.919F-statistic=12.919, and se=13.702se=13.702. Note that the sample consists of 15 randomly selected observations. According to the estimated model, holding all…
- A large city hospital conducted a study to investigate the relationship between the number of unauthorized days that employees are absent per year and the distance (miles) between home and work for the employees. A sample of 10 employees was selected and the following data were collected. Develop a scatter diagram for these data. Does a linear relationship appear reasonable? Explain. Develop the least squares estimated regression equation that relates the distance to work to the number of days absent. Predict the number of days absent for an employee that lives 5 miles from the hospital.We expect a car's highway gas mileage to be related to its city gas mileage (in miles per gallon, mpg). Data for all 12591259 vehicles in the government's 2019 Fuel Economy Guide give the regression line highway mpg=8.720+(0.914×city mpg)highway mpg=8.720+(0.914×city mpg) for predicting highway mileage from city mileage. (c) Find the predicted highway mileage, ?̂ ,�^, for a car that gets 1212 mpg in the city. Give your answer to three decimal places. ?̂ =�^= mpg Find the predicted highway mileage, ?̂ ,�^, for a car that gets 2222 mpg in the city. Give your answer to three decimal places. ?̂ =�^= mpgUse least squares regression to fit a line to the table data below.
- Interpret the slope of the least square regression line in contentListed below are altitudes (thousands of feet) and outside air temperatures (°F) recorded during a flight. Find the (a) explained variation, (b) unexplained variation, and (c) indicated prediction interval. There is sufficient evidence to support a claim of a linear correlation, so it is reasonable to use the regression equation when making predictions. For the prediction interval, use a 95% confidence level with an altitude of 6327 ft (or 6.327 thousand feet). Altitude 2 8 13 23 28 31 32 Temperature 56 40 27 −1 −34 −41 −50 a. Find the explained variation. (Round to two decimal places as needed.) b. Find the unexplained variation. (Round to five decimal places as needed.) c. Find the indicated prediction interval. ______°F<y<______°FA real estate builder wishes to determine how house size (House) is influenced by family income (Income) and family size (Size). House size is measured in meter square and income is measured in IDR millions. The builder randomly selected 50 families and ran the multiple regression. Partial Microsoft Excel output is provided below: What is the sample estimates of the regression problem? Which of the independent variables in the model are significant at the 5% level? Formulate the hypothesis and explain the answer.
