• Interquartile range IQR = Qs – Q1 = 1.58 – 1.36 = 0.22 a. For male students • Mean = 1.457143 20.4 N 14 GWA (x) d (Deviation from the mean) -0.39714286 -0.12714286 Median Med 142+145 1.435 1.06 1.1236 0.157722 1.33 1.7689 0.016165 Minimum and maximum values 1.34 1.7956 -0.11714286 0.013722 Min (x) = 1.06 Мax (x) - 1.75 1.36 1.8496 -0.09714286 0.009437 1.38 1.9044 -0.07714286 0.005951 0.00138 0.00138 1.42 2.0164 -0.03714286 1.42 2.0164 -0.03714286 1.45 2.1025 -0.00714286 0.000051 1.52 2.3104 0.062857143 0.003951 1.56 2.4336 0.102857143 0.01058 1.58 2.4964 0.015094 0.122857143 0.142857143 1.60 1.63 2.56 0.020408 2.6569 0.172857143 0.02988 First and third quartiles 1.75 3.0625 0.292857143 0.085765 Q. = () • N | • 14 = 3.5 or 4th quartile Ex= 20.4, N= 14 Ex = 30.0972 Ed= -0.04 =0.371486 Standard deviation and variance Q=1.36 Q3 = ) -N Population variance - g² = £d² _ 0371486 0.0265 %3D 14 • 14 = 10.5 or 11th quartile Q-1.58 Population standard deviation - o = Vo? V0.0265 = 0.1628 0.3716 %3D Range Range = highest value – lowest value - 1.75 – 1.06 Sample variance - s² 0.0286 N-1 14-1 Sample standard deviation - s = • 0.0286 = 0.1691 = 0.69
• Interquartile range IQR = Qs – Q1 = 1.58 – 1.36 = 0.22 a. For male students • Mean = 1.457143 20.4 N 14 GWA (x) d (Deviation from the mean) -0.39714286 -0.12714286 Median Med 142+145 1.435 1.06 1.1236 0.157722 1.33 1.7689 0.016165 Minimum and maximum values 1.34 1.7956 -0.11714286 0.013722 Min (x) = 1.06 Мax (x) - 1.75 1.36 1.8496 -0.09714286 0.009437 1.38 1.9044 -0.07714286 0.005951 0.00138 0.00138 1.42 2.0164 -0.03714286 1.42 2.0164 -0.03714286 1.45 2.1025 -0.00714286 0.000051 1.52 2.3104 0.062857143 0.003951 1.56 2.4336 0.102857143 0.01058 1.58 2.4964 0.015094 0.122857143 0.142857143 1.60 1.63 2.56 0.020408 2.6569 0.172857143 0.02988 First and third quartiles 1.75 3.0625 0.292857143 0.085765 Q. = () • N | • 14 = 3.5 or 4th quartile Ex= 20.4, N= 14 Ex = 30.0972 Ed= -0.04 =0.371486 Standard deviation and variance Q=1.36 Q3 = ) -N Population variance - g² = £d² _ 0371486 0.0265 %3D 14 • 14 = 10.5 or 11th quartile Q-1.58 Population standard deviation - o = Vo? V0.0265 = 0.1628 0.3716 %3D Range Range = highest value – lowest value - 1.75 – 1.06 Sample variance - s² 0.0286 N-1 14-1 Sample standard deviation - s = • 0.0286 = 0.1691 = 0.69

Glencoe Algebra 1, Student Edition, 9780079039897, 0079039898, 2018
18th Edition
ISBN:9780079039897
Author:Carter
Publisher:Carter
Chapter10: Statistics
Section10.4: Distributions Of Data
Problem 19PFA

Related questions
Question
I need help on this: Construct box-plots of the GWAs for the males and females. Compare the two data distributions of GWAs.
Here are the statistics for basis.
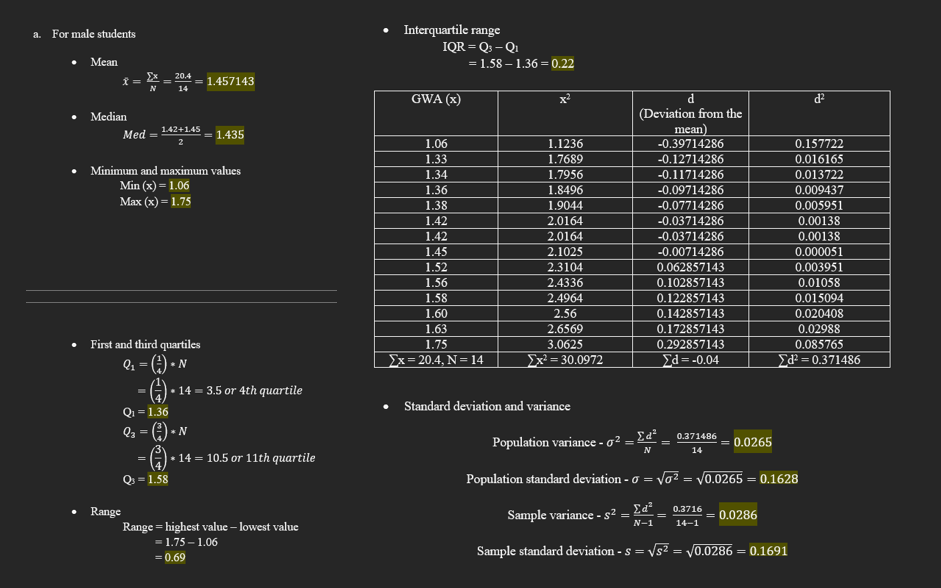
Transcribed Image Text:a. For male students
Interquartile range
IQR = Qs – QI
Mean
= 1.58 – 1.36 = 0.22
20.4
1.457143
N
14
GWA (x)
d
d?
(Deviation from the
mean)
-0.39714286
Median
Med =
1.42+1.45
1.435
1.06
1.1236
0.157722
1.33
1.7689
-0.12714286
0.016165
Minimum and maximum values
1.34
1.36
1.7956
-0.11714286
0.013722
Min (x) = 1.06
Маx (х) — 1.75
1.8496
-0.09714286
0.009437
1.38
1.9044
-0.07714286
0.005951
1.42
2.0164
-0.03714286
0.00138
1.42
2.0164
-0.03714286
0.00138
1.45
2.1025
-0.00714286
0.000051
1.52
2.3104
0.062857143
0.003951
1.56
2.4336
0.102857143
0.01058
1.58
2.4964
0.122857143
0.015094
1.60
2.56
0.142857143
0.020408
1.63
2.6569
0.172857143
0.02988
First and third quartiles
1.75
3.0625
0.292857143
0.085765
Q; = () • N
• 14 = 3.5 or 4th quartile
Ex = 20.4, N= 14
Ex = 30.0972
Ed = -0.04
Ed? = 0.371486
Standard deviation and variance
Q=1.36
Q = () .
* N
0.371486
Population variance - g? = Ed²
= 0.0265
14
• 14 = 10.5 or 11th quartile
Q = 1.58
Population standard deviation - o = Vo? = V0.0265 = 0.1628
• Range
Range = highest value – lowest value
0.3716
Sample variance - s² =
N-1
0.0286
14-1
= 1.75 – 1.06
Sample standard deviation - s =
V0.0286 = 0.1691
= 0.69
Transcribed Image Text:GWA (x)
x
d
d?
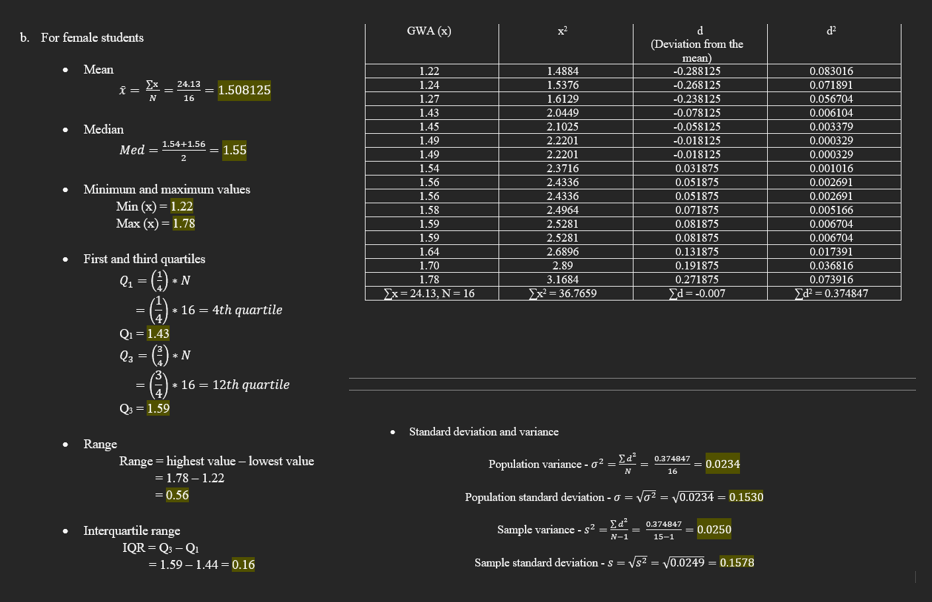
b. For female students
(Deviation from the
mean)
• Mean
1.4884
0.083016
1.22
-0.288125
Ex
1.24
1.5376
-0.268125
24.13
0.071891
=
1.508125
16
1.27
1.6129
-0.238125
0.056704
1.43
2.0449
-0.078125
0.006104
• Median
1.45
2.1025
-0.058125
0.003379
1.49
2.2201
-0.018125
0.000329
1.54+1.56
Med
1.55
1.49
2.2201
-0.018125
0.000329
2
1.54
2.3716
0.031875
0.001016
1.56
2.4336
0.051875
0.002691
Minimum and maximum values
1.56
2.4336
0.051875
0.002691
Min (x) = 1.22
Маx (х) — 1.78
1.58
2.4964
0.071875
0.005166
1.59
2.5281
0.081875
0.006704
1.59
1.64
2.5281
0.081875
0.006704
2.6896
0.131875
0.017391
First and third quartiles
1.70
2.89
0.191875
0.036816
Q1 = () • N
1.78
3.1684
0.271875
0.073916
Ex = 24.13, N = 16
Ex = 36.7659
Ed = -0.007
Ed = 0.374847
| • 16 = 4th quartile
Q1 = 1.43
Q3 = )
* N
• 16 = 12th quartile
= 1.59
• Standard deviation and variance
Range
Range = highest value – lowest value
= 1.78 – 1.22
Population variance - g² = Ed*
0.374847
= 0.0234
16
= 0.56
Population standard deviation - o =
0.0234 = 0.1530
Σα"
0.374847
• Interquartile range
Sample variance - s² =
0.0250
N-1
15-1
IQR = Qs – Q1
= 1.59 – 1.44 = 0.16
Sample standard deviation -s = Vs2 = V0.0249 = 0.1578
%3D
||
Expert Solution
This question has been solved!
Explore an expertly crafted, step-by-step solution for a thorough understanding of key concepts.

Step by step
Solved in 2 steps with 2 images

Recommended textbooks for you
Glencoe Algebra 1, Student Edition, 9780079039897…
Algebra
ISBN:
9780079039897
Author:
Carter
Publisher:
McGraw Hill
Glencoe Algebra 1, Student Edition, 9780079039897…
Algebra
ISBN:
9780079039897
Author:
Carter
Publisher:
McGraw Hill