ion e to search * Question Completion Status: 1 0 High School GPA 500 4.0 O There is a positive linear trend. O There is a negative linear trend. O There is no linear trend. 2.0 1000 QUESTION 2 Which of the following best describes the trend of the graph? Scatterplot of High School GPA vs Shoe Size 5 100 .. • 6 *. 1500 2000 2500 Area (in square feet) 7 O O There is a positive linear trend. O There is a negative linear trend. O There is no linear trend. 8 9 Shoe Size 3000 3500 10 QUESTION 3 Which of the following best describes the trend of the graph? Scatterplot of Salary vs Start Year 11 12 Click Save and Submit to save and submit. Click Save All Answers to save all answers.
ion e to search * Question Completion Status: 1 0 High School GPA 500 4.0 O There is a positive linear trend. O There is a negative linear trend. O There is no linear trend. 2.0 1000 QUESTION 2 Which of the following best describes the trend of the graph? Scatterplot of High School GPA vs Shoe Size 5 100 .. • 6 *. 1500 2000 2500 Area (in square feet) 7 O O There is a positive linear trend. O There is a negative linear trend. O There is no linear trend. 8 9 Shoe Size 3000 3500 10 QUESTION 3 Which of the following best describes the trend of the graph? Scatterplot of Salary vs Start Year 11 12 Click Save and Submit to save and submit. Click Save All Answers to save all answers.

Chapter4: Linear Functions
Section4.3: Fitting Linear Models To Data
Problem 22SE: The U.S. Census tracks the percentage of persons 25 years or older who are college graduates. That...

Related questions
Question
Transcribed Image Text:ion
e to search
* Question Completion Status:
1
0
500
High School GPA
O There is a positive linear trend.
O There is a negative linear trend.
O There is no linear trend.
4.0
2.0
1000
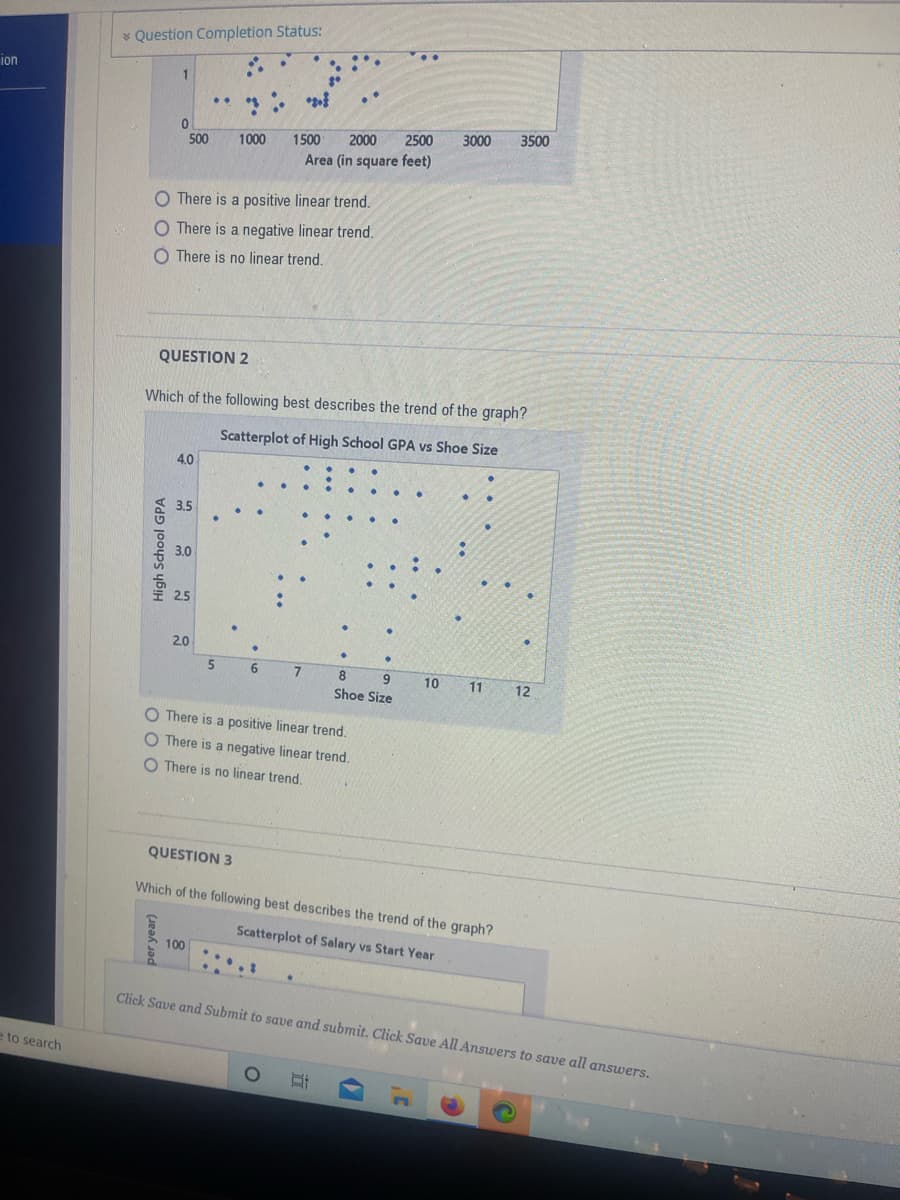
QUESTION 2
Which of the following best describes the trend of the graph?
Scatterplot of High School GPA vs Shoe Size
5
100
•
6
*.
1500 2000 2500
Area (in square feet)
7
O There is a positive linear trend.
O There is a negative linear trend.
O There is no linear trend.
O
8
9
Shoe Size
3000 3500
10
QUESTION 3
Which of the following best describes the trend of the graph?
Scatterplot of Salary vs Start Year
11
12
Click Save and Submit to save and submit. Click Save All Answers to save all answers.
Expert Solution
This question has been solved!
Explore an expertly crafted, step-by-step solution for a thorough understanding of key concepts.

Step by step
Solved in 2 steps with 2 images

Recommended textbooks for you

College Algebra (MindTap Course List)
Algebra
ISBN:
9781305652231
Author:
R. David Gustafson, Jeff Hughes
Publisher:
Cengage Learning

Glencoe Algebra 1, Student Edition, 9780079039897…
Algebra
ISBN:
9780079039897
Author:
Carter
Publisher:
McGraw Hill
College Algebra (MindTap Course List)
Algebra
ISBN:
9781305652231
Author:
R. David Gustafson, Jeff Hughes
Publisher:
Cengage Learning
Glencoe Algebra 1, Student Edition, 9780079039897…
Algebra
ISBN:
9780079039897
Author:
Carter
Publisher:
McGraw Hill

Big Ideas Math A Bridge To Success Algebra 1: Stu…
Algebra
ISBN:
9781680331141
Author:
HOUGHTON MIFFLIN HARCOURT
Publisher:
Houghton Mifflin Harcourt

Algebra and Trigonometry (MindTap Course List)
Algebra
ISBN:
9781305071742
Author:
James Stewart, Lothar Redlin, Saleem Watson
Publisher:
Cengage Learning

Holt Mcdougal Larson Pre-algebra: Student Edition…
Algebra
ISBN:
9780547587776
Author:
HOLT MCDOUGAL
Publisher:
HOLT MCDOUGAL