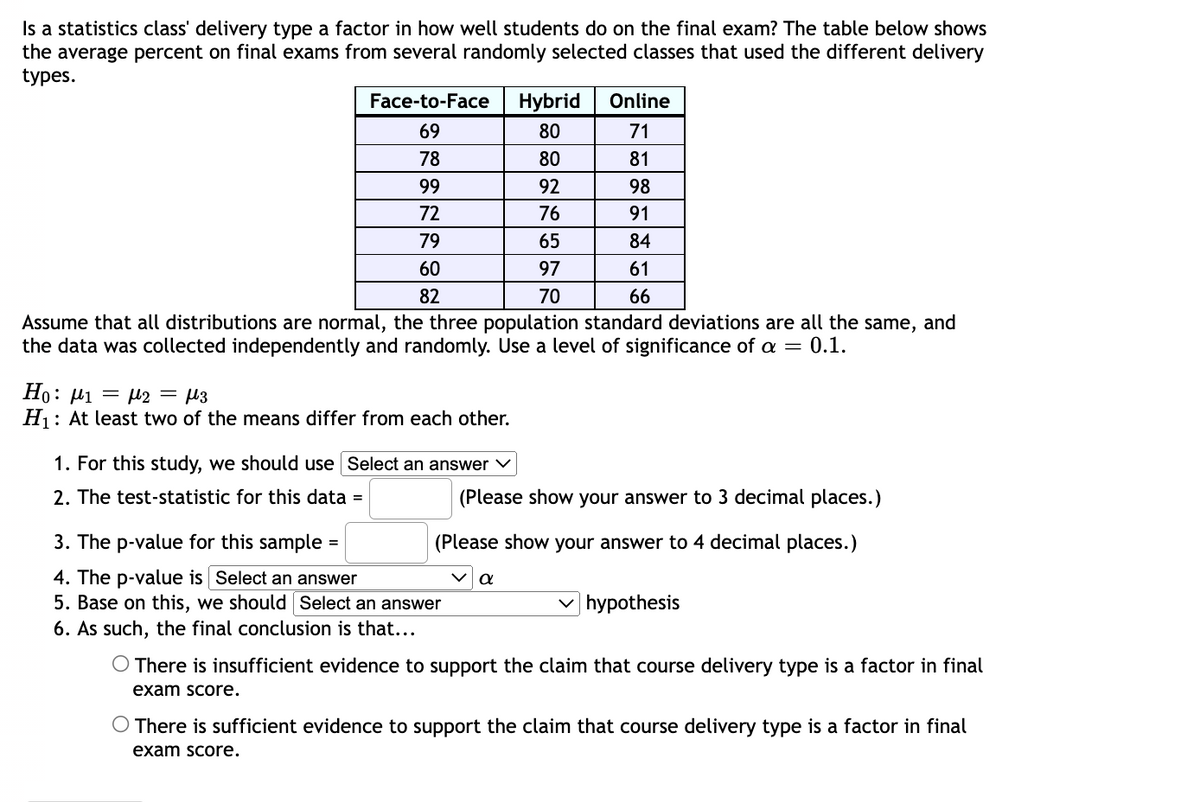
Is a statistics class' delivery type a factor in how well students do on the final exam? The table below shows the average percent on final exams from several randomly selected classes that used the different delivery types. Face-to-Face Hybrid Online 69 80 71 78 80 81 99 92 98 72 76 91 79 65 84 60 97 61 82 70 66 Assume that all distributions are normal, the three population standard deviations are all the same, and the data was collected independently and randomly. Use a level of significance of a = 0.1. Ho: µi = µ2 = µ3 H1: At least two of the means differ from each other. 1. For this study, we should use Select an answer ▼ 2. The test-statistic for this data = (Please show your answer to 3 decimal places.) 3. The p-value for this sample = (Please show your answer to 4 decimal places.)
Is a statistics class' delivery type a factor in how well students do on the final exam? The table below shows the average percent on final exams from several randomly selected classes that used the different delivery types. Face-to-Face Hybrid Online 69 80 71 78 80 81 99 92 98 72 76 91 79 65 84 60 97 61 82 70 66 Assume that all distributions are normal, the three population standard deviations are all the same, and the data was collected independently and randomly. Use a level of significance of a = 0.1. Ho: µi = µ2 = µ3 H1: At least two of the means differ from each other. 1. For this study, we should use Select an answer ▼ 2. The test-statistic for this data = (Please show your answer to 3 decimal places.) 3. The p-value for this sample = (Please show your answer to 4 decimal places.)

Glencoe Algebra 1, Student Edition, 9780079039897, 0079039898, 2018
18th Edition
ISBN:9780079039897
Author:Carter
Publisher:Carter
Chapter10: Statistics
Section10.4: Distributions Of Data
Problem 19PFA

Related questions
Question
Transcribed Image Text:Is a statistics class' delivery type a factor in how well students do on the final exam? The table below shows
the average percent on final exams from several randomly selected classes that used the different delivery
types.
Face-to-Face
Нybrid
Online
69
80
71
78
80
81
99
92
98
72
76
91
79
65
84
60
97
61
82
70
66
Assume that all distributions are normal, the three population standard deviations are all the same, and
the data was collected independently and randomly. Use a level of significance of a = 0.1.
Ho: µi = µ2 = µ3
H1: At least two of the means differ from each other.
1. For this study, we should use Select an answer v
2. The test-statistic for this data =
(Please show your answer to 3 decimal places.)
3. The p-value for this sample =
(Please show your answer to 4 decimal places.)
4. The p-value is Select an answer
5. Base on this, we should Select an answer
v hypothesis
6. As such, the final conclusion is that...
O There is insufficient evidence to support the claim that course delivery type is a factor in final
exam score.
O There is sufficient evidence to support the claim that course delivery type is a factor in final
exam score.
Expert Solution
This question has been solved!
Explore an expertly crafted, step-by-step solution for a thorough understanding of key concepts.

Step by step
Solved in 4 steps

Recommended textbooks for you
Glencoe Algebra 1, Student Edition, 9780079039897…
Algebra
ISBN:
9780079039897
Author:
Carter
Publisher:
McGraw Hill
Glencoe Algebra 1, Student Edition, 9780079039897…
Algebra
ISBN:
9780079039897
Author:
Carter
Publisher:
McGraw Hill