As shown in the attachment I've done part a. Using this template please show me the complete steps to get the graph in part b (eg what cells do you highlight for the graph). A furniture company manufactures desks and chairs. Each desk uses four units of wood, and each chair uses three units of wood. A desk contributes $250 to profit, and a chair contributes $145. Marketing restrictions require that the number of chairs produced be at least four times the number of desks produced. There are 2000 units of wood available. a. Use Solver to maximize the company’s profit. b. Confirm graphically that the solution in part a maximizes the company’s profit. c. Use SolverTable to see what happens to the decision variables and the total profit when the availability of wood varies from 1000 to 3000 in 100-unit increments. Based on your findings, how much would the company be willing to pay for each extra unit of wood over its current 2000 units?


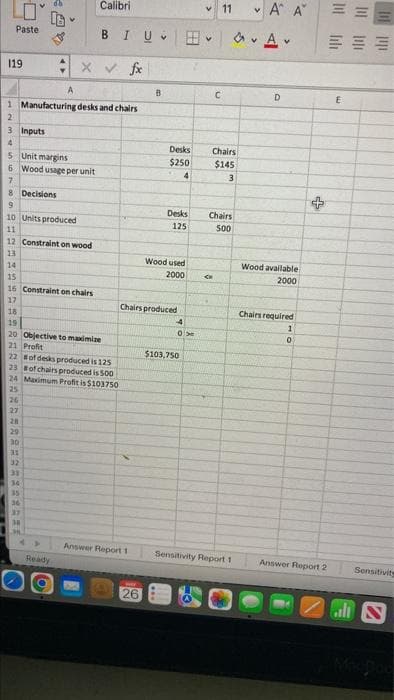
As shown in the attachment I've done part a. Using this template please show me the complete steps to get the graph in part b (eg what cells do you highlight for the graph).
A furniture company manufactures desks and chairs. Each desk uses four units of wood, and each chair uses three units of wood. A desk contributes $250 to profit, and a chair contributes $145. Marketing restrictions require that the number of chairs produced be at least four times the number of desks produced. There are 2000 units of wood available.
a. Use Solver to maximize the company’s profit.
b. Confirm graphically that the solution in part a maximizes the company’s profit.
c. Use SolverTable to see what happens to the decision variables and the total profit when the availability of wood varies from 1000 to 3000 in 100-unit increments. Based on your findings, how much would the company be willing to pay for each extra unit of wood over its current 2000 units?


Trending now
This is a popular solution!

Step by step
Solved in 2 steps with 10 images

Is my formatting correct (see attached image)? I'm still having trouble with getting that graph. What are the steps involved with getting the graph (eg what do I have to highlight)?


