Is the data shown qualitative or quantitative? If so, how?

Glencoe Algebra 1, Student Edition, 9780079039897, 0079039898, 2018
18th Edition
ISBN:9780079039897
Author:Carter
Publisher:Carter
Chapter10: Statistics
Section: Chapter Questions
Problem 25SGR

Related questions
Question
Is the data shown qualitative or quantitative? If so, how?
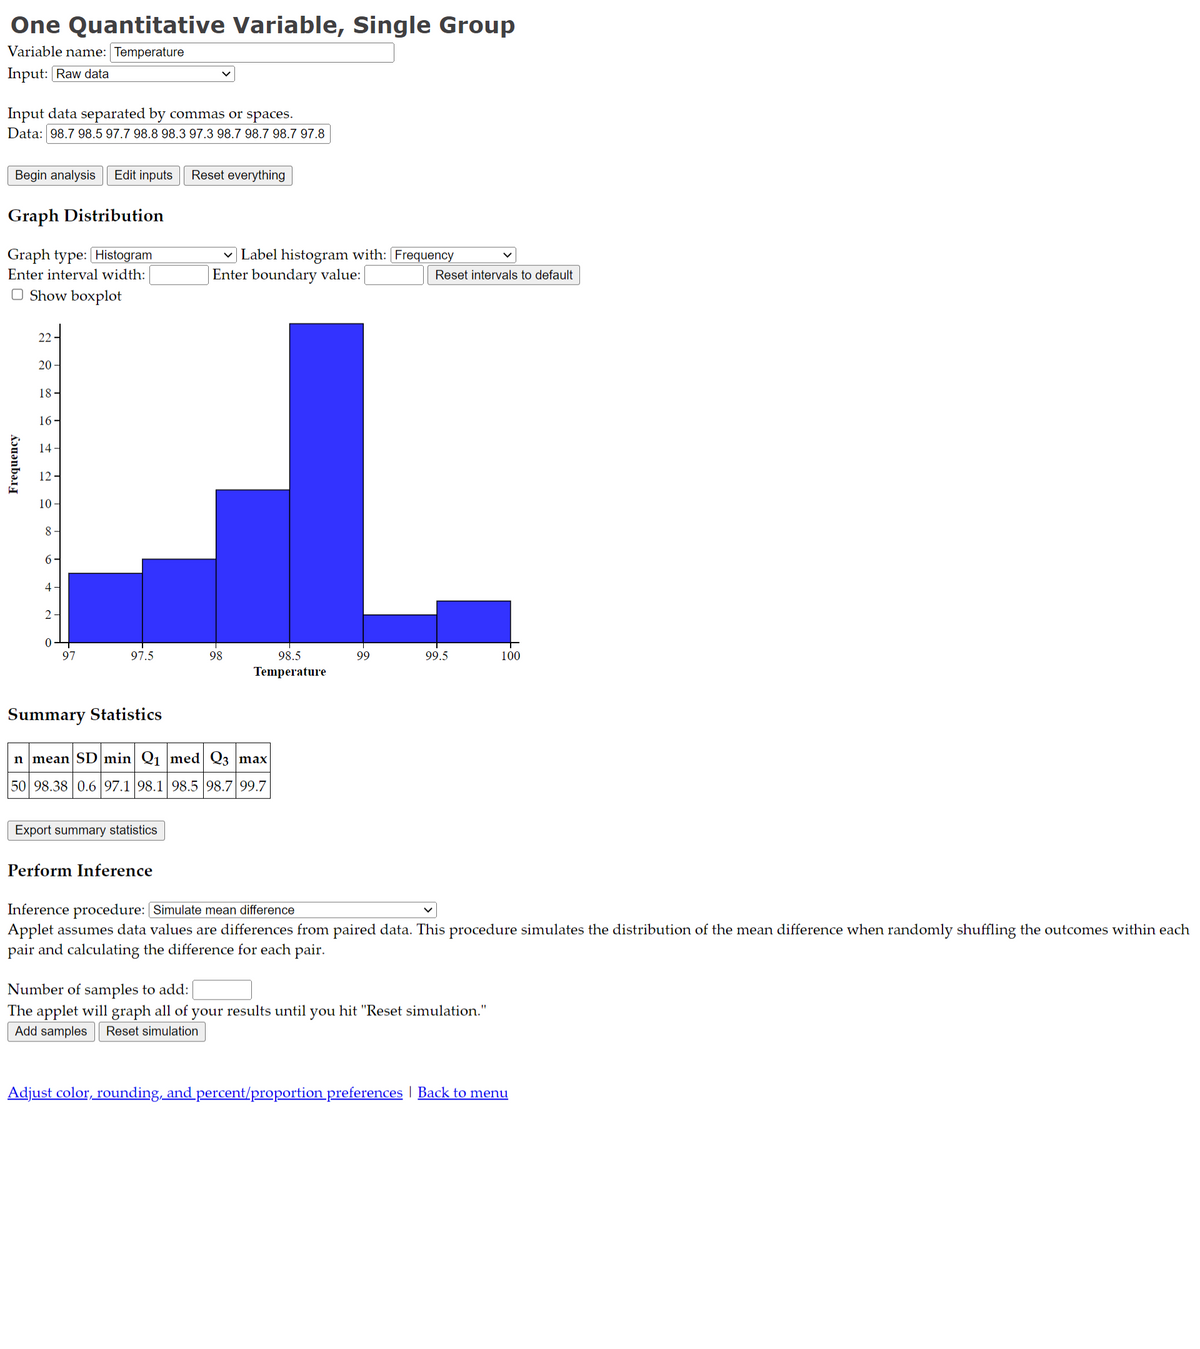
Transcribed Image Text:One Quantitative Variable, Single Group
Variable name: Temperature
Input: Raw data
Input data separated by commas or spaces.
Data: 98.7 98.5 97.7 98.8 98.3 97.3 98.7 98.7 98.7 97.8
Begin analysis Edit inputs Reset everything
Graph Distribution
Graph type: [Histogram
Enter interval width:
O Show boxplot
Frequency
22
20
18
16-
14
12
10
8
6-
4
2
0
97
97.5
Summary Statistics
Export summary statistics
✓Label histogram with: [Frequency
Enter boundary value:
Perform Inference
98
n mean SD min Q₁ med Q3 max
50 98.38 0.6 97.1 98.1 98.5 98.7 99.7
98.5
Temperature
99
Reset intervals to default
99.5
100
Inference procedure: [Simulate mean difference
Applet assumes data values are differences from paired data. This procedure simulates the distribution of the mean difference when randomly shuffling the outcomes within each
pair and calculating the difference for each pair.
Number of samples to add:
The applet will graph all of your results until you hit "Reset simulation."
Add samples Reset simulation
Adjust color, rounding, and percent/proportion preferences | Back to menu
Expert Solution
This question has been solved!
Explore an expertly crafted, step-by-step solution for a thorough understanding of key concepts.

Step by step
Solved in 3 steps

Recommended textbooks for you
Glencoe Algebra 1, Student Edition, 9780079039897…
Algebra
ISBN:
9780079039897
Author:
Carter
Publisher:
McGraw Hill

Linear Algebra: A Modern Introduction
Algebra
ISBN:
9781285463247
Author:
David Poole
Publisher:
Cengage Learning

Big Ideas Math A Bridge To Success Algebra 1: Stu…
Algebra
ISBN:
9781680331141
Author:
HOUGHTON MIFFLIN HARCOURT
Publisher:
Houghton Mifflin Harcourt
Glencoe Algebra 1, Student Edition, 9780079039897…
Algebra
ISBN:
9780079039897
Author:
Carter
Publisher:
McGraw Hill
Linear Algebra: A Modern Introduction
Algebra
ISBN:
9781285463247
Author:
David Poole
Publisher:
Cengage Learning
Big Ideas Math A Bridge To Success Algebra 1: Stu…
Algebra
ISBN:
9781680331141
Author:
HOUGHTON MIFFLIN HARCOURT
Publisher:
Houghton Mifflin Harcourt