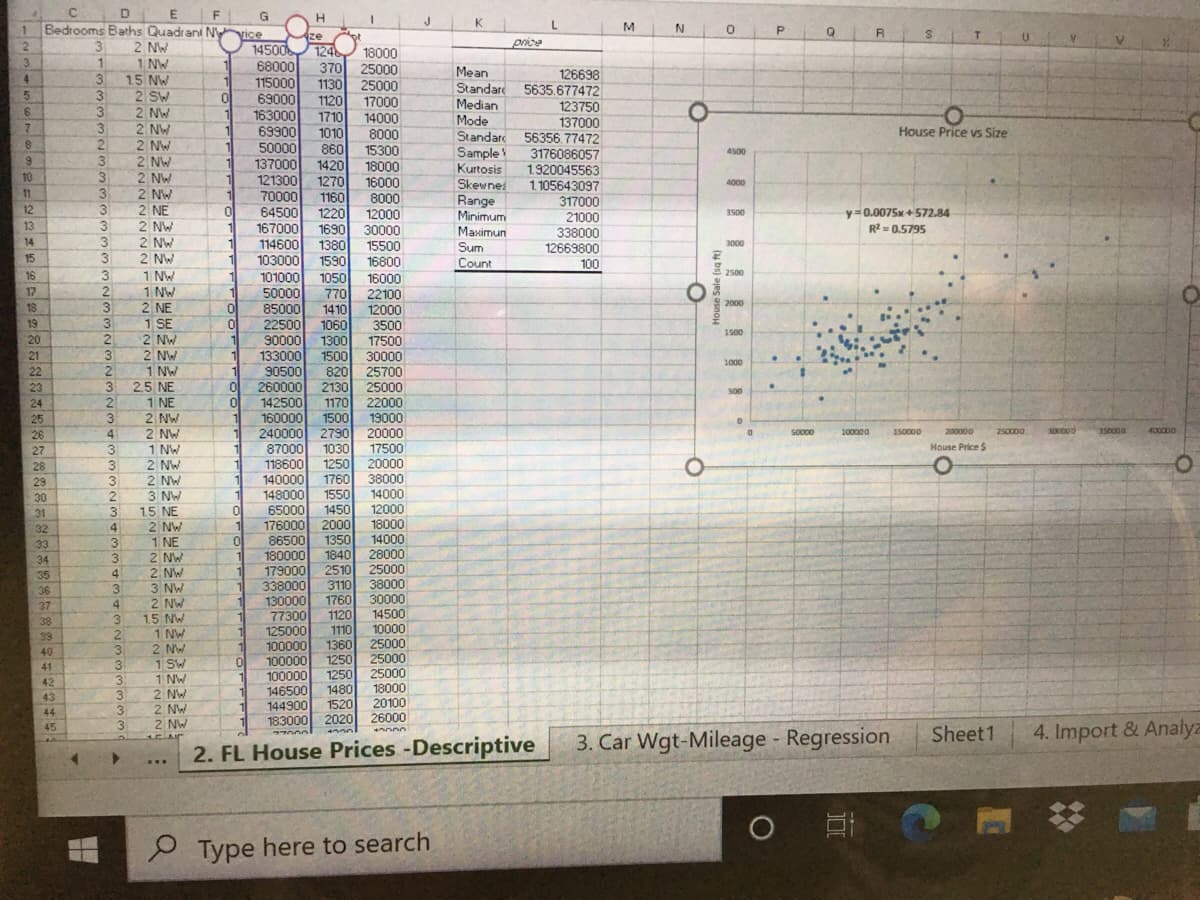
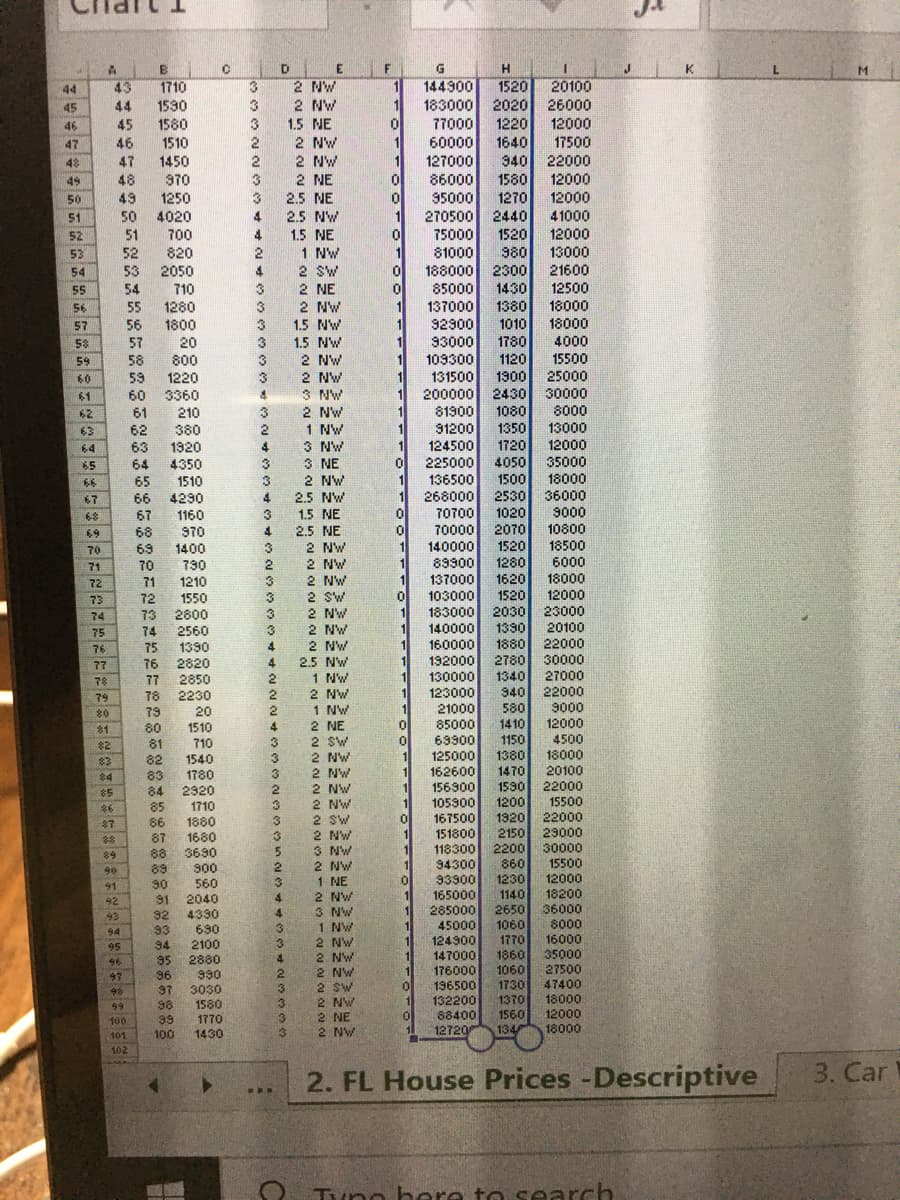
Is the mean or median a better measure of center for this data set? Why?
Q: Does the sample median tend to target the population variance
A: If the original distribution is normal, the sample mean will also be normal, with variance , where n…
Q: . Are the data consistent?
A: Given: Total no of person =500 Nonof person preferred variety A = 400 Nonof person preferred…
Q: What are the different types of data?
A:
Q: which measure of central tendency mean or median best describe the center of the distribution and…
A: Given query is to find the measure which is best to describe center of the distribution.
Q: The "fishing" approach to data analysis refers to what?
A: " fishing" is a data mining practice in which large volumes of data are analyzed seeking any…
Q: Under what conditions would it be better to use the median instead of the mean?
A: n statistics, three measures of central tendency are widely used. These three measures are also…
Q: What caution is must for finding the median for ordered qualitative data?
A:
Q: When would you use the median rather than the mean as a measure of central tendency? Why?
A: Mean: The arithmetic mean (also called the mean) is the most commonly used measure of central…
Q: What is the drawback of summarizing the data using the median
A: Median: Median is the middle value of the set of numbers. The set of numbers should be arranged in…
Q: what is nominal (categorial) data?
A: Categorical data: The type of data that naturally take non-numerical values, such as words that can…
Q: Why is a year of sale is considered as a one example of discrete data? What is the level measurement…
A: Year of sale is discrete data because year of sale is limited sale that can be countable there a…
Q: The numerical measure of center that identifies the data value (or values) that occurs with the…
A: We have to find carek ans
Q: Based on the boxplots and the mean/median relationship what is the shape of each data set? Explain…
A: Given:
Q: what is the value of the mean and median if the data is normally distributed
A: We have given that the diagram percentage of Pigs vs weight in lbs.
Q: When trying to summarize a set of numerical data, why is giving a measure of center such as the mean…
A: Introduction: A measure of central tendency of data is a measure of the tendency of the values to…
Q: The measure of central tendency which is used for categorical data is .... ..
A: The properties of a dataset influence the choice of a central tendency measures. For categorical…
Q: Describe a set of data in which it would be most appropriate to use the mode as the measure of…
A: Mode is a measure of central tendency which represents the most frequent score in our data set. Mode…
Q: You can calculate an average/mean of qualitative data. True or False
A: mean , median and measure of spread can't be calculated for qualitative data, because no natural…
Q: What is the lowest measure of central tendency and is used primarily for nominal data to identify…
A: We know there are mainly three measures of central tendency:Mean, mode and medianWe first know where…
Q: Why is the median less affected by skewed data than the mean?
A: Mean: The average values of the total observations. Median: The value that divided data set into two…
Q: what are the characteristics of a population for which it would be appropriate to use…
A: The measures of centre or measures of central tendency are those descriptive measures that gives the…
Q: Is there any skewness suggested by the mean, mode and median of the ungrouped data?
A: Skewness means lack of symmetry. The values of mean, median and mode fall at different points, they…
Q: Does this table data include mean, median, or mode? What kind of level of measure is used?
A: The data consists the monthly cost of groceries for college students of 51 states.
Q: What is the relationship between a frequency or relativefrequency distribution of a quantitative…
A: Justification:Qualitative and quantitative data:Qualitative data are non-numerical measures such as…
Q: Name the 4 circumstances where the median would provide a better measure of central tendency than…
A: Central tendency: The value that is used for describing the full data set using the central position…
Q: How will a high outlier in a data set affect the mean and median?
A: There is the effect of an outlier on the median value.
Q: A histogram of a set of data indicates that the distribution of the data is skewed right. Which…
A: Correct Option: C
Q: What is the shape of this data analysis?
A: Given data:
Q: Give 2 examples of Median in Measure of central tendency to grouped data
A:
Q: Can you find a set of data such the mean, median, and variance are all equal to each other?
A: A normal distribution is a common probability distribution . It has a shape often referred to as a…
Q: Why is it important to report both a measure of central tendency and variability to describe a set…
A: Basic idea about measures of central tendency and dispersion Measure of Central tendency is the…
Q: How is the goal of descriptive statistics served by computing a measure of central tendency?
A: It is an important part of statistics . It is widely used .
Q: How are measures of central tendency and measures of dispersion complementary to each other while…
A: Mean is one of which given us central tendency of the data. The other two being median and mode. The…
Q: (part 2) Give an example of a set of data for which the mean is lower than the median.
A:
Q: Which of the following measures of central tendency is fit for nominal data like employment status?…
A: Mean: It is the sum of an observations divided by the total number of observations of the data set.…
Q: highly skewed
A:
Q: Hair colors are an example of which type of data?
A: Introduction: There are broadly 4 scales of measurement used in Statistics, that either categorize…
Q: What are the three types of data?
A:
Q: Does the mean represent the center of the data?
A: We have to write Does the mean represent the center of the data.
Q: When are mean, median, and mode the best measure of center?
A:
Q: Why is hair color classified as categorical data?
A: In categorical variable we simply assign labels for identification. Categorical values are discrete…
Q: What is the median of this distribution?
A:
Q: consider a data set with at least three data values. Suppose the highest value is increased by 10…
A: Given consider a data set with at least three data values. Suppose the highest value is increased by…
Q: Why Mode value is one of the given set of data values?
A: Mode: Occasionally, when describing a set of data, the mode is used as a measure of central…
Q: What is the definition of mode of a data set?
A: The mode of the data set is........
Q: Is the Median the most appropriate measure of averages (central tendency) for grouped data? Why? How…
A: Given that Is the Median the most appropriate measure of averages (central tendency) for grouped…
Q: Where are most of the data gathered in a negatively skewed distribution? Which value is largerthe…
A: We have to describe the negatively skewed distribution and locate the position of mean relative…
Q: Can you Describe the role of primary data and secondary data in the classification of data with…
A: Primary Data-The data which will be collected for the first time by the research development people…
Inverse Normal Distribution
The method used for finding the corresponding z-critical value in a normal distribution using the known probability is said to be an inverse normal distribution. The inverse normal distribution is a continuous probability distribution with a family of two parameters.
Mean, Median, Mode
It is a descriptive summary of a data set. It can be defined by using some of the measures. The central tendencies do not provide information regarding individual data from the dataset. However, they give a summary of the data set. The central tendency or measure of central tendency is a central or typical value for a probability distribution.
Z-Scores
A z-score is a unit of measurement used in statistics to describe the position of a raw score in terms of its distance from the mean, measured with reference to standard deviation from the mean. Z-scores are useful in statistics because they allow comparison between two scores that belong to different normal distributions.
Given information:
Step by step
Solved in 2 steps
- Repeat Example 5 when microphone A receives the sound 4 seconds before microphone B.Resistors labeled as 100 Ω are purchased from two different vendors. The specification for this type of resistor is that its actual resistance be within 5% of its labeled resistance. In a sample of 180 resistors from vendor A, 150 of them met the specification. In a sample of 270 resistors purchased from vendor B, 233 of them met the specification. Vendor A is the current supplier, but if the data demonstrate convincingly that a greater proportion of the resistors from vendor B meet the specification, a change will be made. a) State the appropriate null and alternate hypotheses. b) Find the P-value. c) Should a change be made?Resistors labeled as 100 Ω are purchased from two different vendors. The specification for this type of resistor is that its actual resistance be within 5% of its labeled resistance. In a sample of 180 resistors from vendor A, 149 of them met the specification. In a sample of 270 resistors purchased from vendor B, 233 of them met the specification. Vendor A is the current supplier, but if the data demonstrate convincingly that a greater proportion of the resistors from vendor B meet the specification, a change will be made. P-value?
- 1. Consumers at a ABC arrive at a rate of 45 per hr. There are three servers that can process customers at an average of 3 mins. (a) What is the average wait time? (b) What is the average number of customers waiting? (c) What is the average number of customers in the DMV? 2. A small entrepreneurial company is trying to decide between developing twodifferent products that they believe they can sell to two potential companies, one large andone small. If they develop Product A,they have a 50% chance of selling it to the largecompany with annual purchases of about 20,000 units.If the large company won't purchaseit, then they think they have an 80% chance of placing it with a smaller company, with salesof 15,000 units.On the other hand if they develop Product B, they feel they have a 40%chance of selling it to the large company, resulting in annual sales of about 17,000 units. If the large company doesn't buy it, they have a 50% chance of selling it to the small company with sales of…No. Emp. No. Prod. Wkrs. Value Added by Mfg. Cost of Materials Value of Indus. Shipmnts New Cap. Exp. End Yr. Inven. Indus. Grp. 433 370 23518 78713 4 1833 3630 1 131 83 15724 42774 4 1056 3157 1 204 169 24506 27222 4 1405 8732 1 100 70 21667 37040 4 1912 3407 1 220 137 20712 12030 4 1006 1155 1 89 69 12640 13674 3 873 3613 1 26 18 4258 19130 3 487 1946 1 143 72 35210 33521 4 2011 7199 1 171 126 20548 19612 4 1135 3135 1 21 15 23442 5557 3 605 5506 2 3 2 287 163 1 2 42 2 2 2 1508 314 1 15 155 2 6 4 624 2622 1 27 554 2 52 47 2471 4219 2 292 929 3 74 63 4307 5357 2 454 1427 3 13 12 673 1061 1 20 325 3 17 13 817 707 1 84 267 3 169 147 8986 10421 3 534 2083 3 51 41 3145 4140 2 220 697 3 55 44 4076 7125 2 176 1446 3 84 76 3806 8994 2 423 1014 3 61 47 4276 5504 2 464 1291 3 27 22 1239 716 1 22 356 4 200 178 9423 8926 3 200 2314 4 294 250 11045 11121 3 189 2727 4 38 32 1916 2283 1 29 682 4 17 14 599 364 1 21 197 4 34 28 2063 1813 1 20…Low Carbohydrate Low Fat Mediterranean TOTAL n % n % n % N % Gender 26 26 26 78 Female 15 57.7 15 57.7 14 53.8 44 56.44 Male 11 42.3 11 42.3 12 46.2 34 43.6 Age Group 18-34 years 7 27.9 7 26.9 6 23.1 20 25.6 35-40 years 13 50 14 15.4 15 57.7 42 53.8 50+ years 6 23.1 5 19.2 5 19.2 16 20.5 BMI Category Normal weight 9 34.6 6 23.1 7 26.9 22 28.2 Overweight 11 42.3 13 50 12 46.2 36 46.2 Obese 6 23.1 7 26.9 7 26.9 20 25.6 Write a narrative summary of these findings. Be sure to include a description of the total sample as well as a description of each intervention group.
- Low Carbohydrate Low Fat Mediterranean TOTAL n % n % n % N % Gender 26 26 26 78 Female 15 57.7 15 57.7 14 53.8 44 56.44 Male 11 42.3 11 42.3 12 46.2 34 43.6 Age Group 18-34 years 7 27.9 7 26.9 6 23.1 20 25.6 35-40 years 13 50 14 15.4 15 57.7 42 53.8 50+ years 6 23.1 5 19.2 5 19.2 16 20.5 BMI Category Normal weight 9 34.6 6 23.1 7 26.9 22 28.2 Overweight 11 42.3 13 50 12 46.2 36 46.2 Obese 6 23.1 7 26.9 7 26.9 20 25.6 Low Carbohydrate Low Fat Mediterranean TOTAL Mean (sd) 95% CI (LL,UL) Mean (sd) 95% CI (LL,UL) Mean (sd) 95% CI (LL,UL) Mean (sd) 95% CI (LL,UL) Age 39.58 (10.257) (35.54, 43.29) 39.27 (9.594) (35.58, 42.54) 39.69 (10.403) (35.88, 43.65) 39.51 (9.961) (37.17,…Low Carbohydrate Low Fat Mediterranean TOTAL n % n % n % N % Gender 26 26 26 78 Female 15 57.7 15 57.7 14 53.8 44 56.44 Male 11 42.3 11 42.3 12 46.2 34 43.6 Age Group 18-34 years 7 27.9 7 26.9 6 23.1 20 25.6 35-40 years 13 50 14 15.4 15 57.7 42 53.8 50+ years 6 23.1 5 19.2 5 19.2 16 20.5 BMI Category Normal weight 9 34.6 6 23.1 7 26.9 22 28.2 Overweight 11 42.3 13 50 12 46.2 36 46.2 Obese 6 23.1 7 26.9 7 26.9 20 25.6 Low Carbohydrate Low Fat Mediterranean TOTAL Mean (sd) 95% CI (LL,UL) Mean (sd) 95% CI (LL,UL) Mean (sd) 95% CI (LL,UL) Mean (sd) 95% CI (LL,UL) Age 39.58 (10.257) (35.54,43.27) 39.27 (9.594) (35.58,42.54) 39.69 (10.403)…Low Carbohydrate Low Fat Mediterranean TOTAL n % n % n % N % Gender 26 26 26 78 Female 15 57.7 15 57.7 14 53.8 44 56.44 Male 11 42.3 11 42.3 12 46.2 34 43.6 Age Group 18-34 years 7 27.9 7 26.9 6 23.1 20 25.6 35-40 years 13 50 14 15.4 15 57.7 42 53.8 50+ years 6 23.1 5 19.2 5 19.2 16 20.5 BMI Category Normal weight 9 34.6 6 23.1 7 26.9 22 28.2 Overweight 11 42.3 13 50 12 46.2 36 46.2 Obese 6 23.1 7 26.9 7 26.9 20 25.6 Low Carbohydrate Low Fat Mediterranean TOTAL Mean (sd) 95% CI (LL,UL) Mean (sd) 95% CI (LL,UL) Mean (sd) 95% CI (LL,UL) Mean (sd) 95% CI (LL,UL) Age 39.58 (10.257) (35.54, 43.29) 39.27 (9.594) (35.58, 42.54) 39.69 (10.403) (35.88, 43.65) 39.51 (9.961) (37.17,…