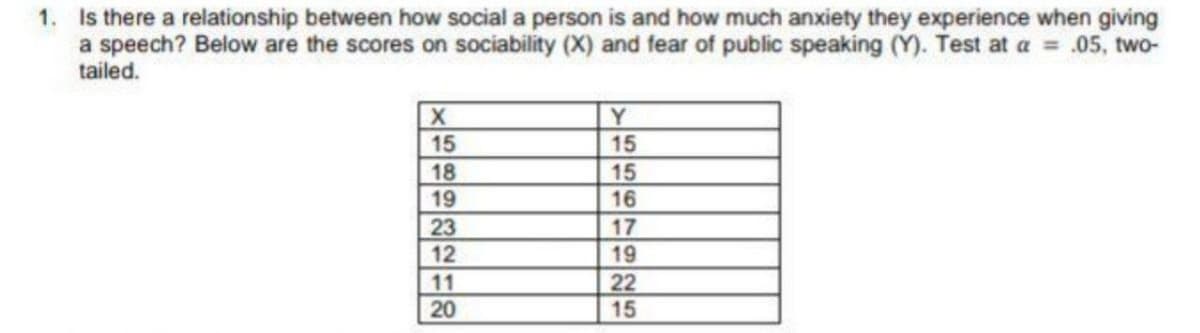
Is there a relationship between how social a person is and how much anxiety they experience when giving a speech? Below are the scores on sociability (X) and fear of public speaking (Y). Test at a = .05, two- tailed. Y 15 15 18 19 15 16 23 12 17 19 11 20 22 15
Q: Here is a scatter plot for a set of bivariate data. What would you estimate the correlation…
A: We have to find correlation coefficient from the given data
Q: Find the standard deviation of the correlation coefficient using the data below. (Sr) >x? = 1667 Er…
A: From the given information, the correlation coefficient isr=∑XY∑X2∑Y2=141216671667=14141667=0.8482
Q: t Center Hospital, there is some concern about the high turnover of nurses. A survey was done to…
A: Quartile 1 is given by Q1 =(N+14)thvalue Q1 =(20+14)thvalue Q1 =(5.25)thvalue Q1 =(5)thvalue +…
Q: A biologist looked at the relationship between number of seeds a plant produces and the percent of…
A: You have posted multiple sub parts. As per Bartleby rules, I am solving 3 sub parts. Please re-post…
Q: How hot does it get in Death Valley? The following data are taken from a study conducted by the…
A: It provided that the sample size of ground temperature (n) is 14.Consider X is defined as the ground…
Q: The table below gives the number of accidents each year at a particular road junction: 2013 2014…
A: It is given that:
Q: Consider the following data relating hours spent studying (X) and average grade on course quizzes…
A: The variability is explained by using coefficient of determination. The coefficient of determination…
Q: What is the value of r? a) 0.8620 b) -0.8620 c) 0.9236 d) -0.927 e) 0.927 f)…
A: Answer: For the given data,
Q: Justify your answers and show calculations, if any. (i) Is a linear relationship between S1 and S2…
A: (i) From the given output it can be observed that the scatterplot for the two variables is following…
Q: The weights (in pounds) of 6 vehicles and the variability of their braking distances (in feet)…
A: Sample size (n) = 6 The values of x and y are α=0.05
Q: he acres of living area (x) and the selling price in millions of dollars (y) for 5 real estate…
A: State the hypotheses.
Q: To measure the relationship between emotional intelligence and marital satisfaction, a psychologist…
A:
Q: A Mexican restaurant took a survey to find out the wait time of 10 of their customers. The data is…
A: Since you have asked multiple questions, we will solve the first question for you. If you want any…
Q: A study evaluated the serum acid levels in individuals with Down's syndrome and normal individuals,…
A: Solution
Q: Store Shelf space (X) (feet) Weekly sales (Y) ($) 1 5 160 2 220 140 4 10 190 10 240 10 260 7 15 230…
A:
Q: A survey is conducted to young adults after they tasted a new brand of soda. Their satisfaction…
A: Box plot : Box plot is use full to compare the data graphically and it is most appropriate method to…
Q: A sample of scores has a mean of ? = 65 and ? = 15. Find the z-scores that correspond to the…
A: We have given that. X~N( μ , ?^2 ) μ=65 , ?=15 Z-score =( x - μ )/?
Q: s. Determine whether this result is a statistic or a parameter. .....
A:
Q: A sample of scores has a mean of ? = 35 and ? = 6. Find the z-scores that correspond to the…
A: We have given that, Let Y be the random variable from normal distribution with mean (μ) = 35 and…
Q: The table given below is for scores in Management Accounting M.A) and Quantitative Techniques (Q.T).…
A: Let X = MA Y = QT X = MA Y = QT 86 80 77 82 68 73 71 69 67 72 90 85 78 84 71 65…
Q: he following data were obtained from a repeated-measures research study. What is the value the…
A: The difference column can be calculated as
Q: Use the data to the right to complete parts (a) through (d) below. Percentage Who Won't Try Don't…
A: Given data, X Y X*Y X*X 45 37 1665 2025 48 39 1872 2304 64 56 3584 4096 76 68 5168 5776
Q: The test yielded a t-value of 1.592 with a corresponding p-value of 0.059. Which of the following is…
A: The test is right-tailed. The value of the test-statistic is 1.592 and the P-value is 0.059.
Q: Use the data values in the table below to calculate the correlation between the variables x and y.…
A: Given data is x y 2 13.65 3 10.04 4 11.13 5 6.82 6 5.61 7 5.7
Q: Here is a bivariate data set. y 61.9 22.3 38.4 64.6 66.7 0.4 62.1 -13 42.6 69.1 Find the correlation…
A: Correlation coefficient: Correlation is the statistical measure that shows the relation between two…
Q: Run a regression analysis on the following data set with y as the response variable. X y 39.5 12.5…
A: Given: The provided data is: x 39.5 35.1 36.8 11.2 21.5 34.1 45.2 41.5 54 y 12.5 18.5 32.6…
Q: A random sample of patients visiting a hospital emergency room was obtained and the waiting time of…
A: Given,sample size(n)=25sample mean(x¯)=∑xnsample mean(x¯)=100625sample mean(x¯)=40.24
Q: The following data relate to sizes of shoes sold at a store during a given week. Find the median of…
A: Given: Size of shoes (x) No of pairs (f) 5 2 5.5 5 6 15 6.5 30 7 60 7.5 40 8 23…
Q: Calculate Karl Pearson's Co-efficient of skewness from the data given below: Value : Frequency: 10…
A: Solution:
Q: Use the data values in the table below to calculate the correlation between the variables x and y.…
A:
Q: Use the paired data below to test the claim that there is a correlation between x and y, using…
A: We have given that, The data set are, X :- 46.6, 27.7, 43.1, 29, 34.8 Y:- 8, 8, 3,…
Q: Use the data to find the P-value in a test for linear correlation between x and y. 1 4 4. 4 None of…
A: First we need to find correlation coefficient. Correlation coefficient test : Hypothesis : H0 :…
Q: The number of hours 10 students spent studying for a test and their scores on that test are shown in…
A:
Q: The following data relate to sizes of shoes sold at a store during a given week. Find the median of…
A: Given Data : X = Size of shoes Frequency = No. of Pairs 5 2 5.5 5 6 15 6.5 30 7 60…
Q: The data shown to the right for the dependent variable, y, and the independent variable, x, have…
A: The independent variable is x. The dependent variable is y. The given data represents simple linear…
Q: Use the data values in the table below to calculate the correlation between the variables x and y.…
A:
Q: Use the data to the right to complete parts (a) through (d) below. Percentage Who Won't Try Don't…
A: Given that : A data set is given By using correlation coefficient and Reggresion coefficient…
Q: To make a decision about closing time, a fast food restauranthas recorded data on the number of…
A: Interquartile range is the difference between lower quartile & upper quartile . The first…
Q: Jeffery surveyed 50 randomly selected workers at a factory. He collected data about the individual…
A:
Q: To measure the relation between the gender and education level, which one is the appropriate…
A:
Q: Calculate coefficient of correlation from the data given below by the direct method, i.e., without…
A:
Q: Use the data to the right to complete parts (a) through (d) below. Percentage Who Won't Try Don't…
A: Given that; A data set is here By using the formula of correlation coefficient (r)and regression…
Q: Here is a scatter plot for a set of bivariate data. A What would you estimate the correlation…
A: Scatter polt is used to plot bivariate variable. It helps to understand the outlier and the…
Q: Here is a scatter plot for a set of bivariate data. O O 00 What would you estimate the correlation…
A: Solution: 24. The scatterplot for the bivariate data is given.
Q: A physics tuition teacher claims that the usual practice of going through exercises during the class…
A: Given the tables provides the average scores of students in their recent physics quarterly tests…
Q: The following data concerning the birth weight (in grams) of newborns resulted from a study that…
A: hypothesisHo:μ1=μ2H1:μ1≠μ2test…
Q: The number of hours 10 students spent studying for a test and their scores on that test are shown in…
A: Hypothesis : H0 : ρ = 0 , i.e. there is a no significance linear correlation between the data H1 :…
Q: From the data given below calculate a coefficient of skewness based on percentiles. Marks Number of…
A:
Q: A grocery store manager did a study to look at the relationship between the amount of time (in…
A: Here, we are conducting the correlation coefficient of the given data. There are 2 variables which…
Q: The weights (in pounds) of 6 vehicles and the variability of their braking distances (in feet)…
A: Linear correlation coefficient: Use the EXCEL formula, "=CORREL(A2:A7,B2:B7)". The value obtained is…
Step by step
Solved in 2 steps