Is there a way to compute using Excel?

Functions and Change: A Modeling Approach to College Algebra (MindTap Course List)
6th Edition
ISBN:9781337111348
Author:Bruce Crauder, Benny Evans, Alan Noell
Publisher:Bruce Crauder, Benny Evans, Alan Noell
Chapter3: Straight Lines And Linear Functions
Section3.CR: Chapter Review Exercises
Problem 15CR: Life Expectancy The following table shows the average life expectancy, in years, of a child born in...

Related questions
Topic Video
Question
Is there a way to compute using Excel?
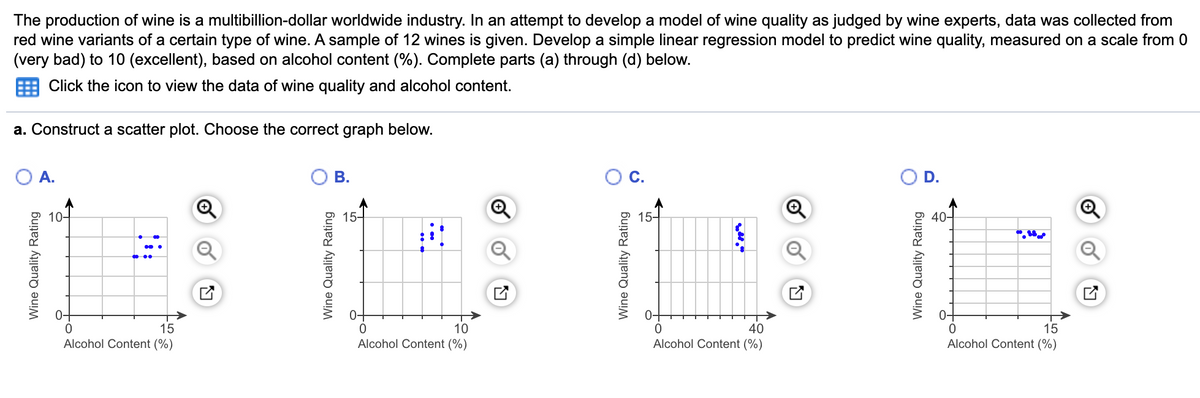
Transcribed Image Text:The production of wine is a multibillion-dollar worldwide industry. In an attempt to develop a model of wine quality as judged by wine experts, data was collected from
red wine variants of a certain type of wine. A sample of 12 wines is given. Develop a simple linear regression model to predict wine quality, measured on a scale from 0
(very bad) to 10 (excellent), based on alcohol content (%). Complete parts (a) through (d) below.
Click the icon to view the data of wine quality and alcohol content.
a. Construct a scatter plot. Choose the correct graph below.
A.
В.
D.
10-
15-
15-
40-
0-
15
10
40
15
Alcohol Content (%)
Alcohol Content (%)
Alcohol Content (%)
Alcohol Content (%)
Wine Quality Rating
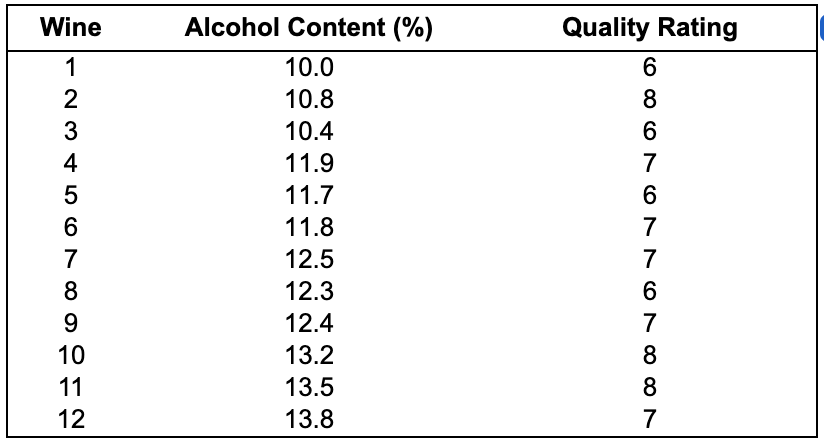
Transcribed Image Text:Wine
Alcohol Content (%)
Quality Rating
1
10.0
6
2
10.8
8
3
10.4
6
4
11.9
7
11.7
6
11.8
7
7
12.5
7
8
12.3
9.
12.4
7
10
13.2
8
11
13.5
8
12
13.8
7
Expert Solution
Step 1
Given:
The percentage of Alcohol content and their quality rating for 12 different wines.

Step by step
Solved in 2 steps with 1 images

Knowledge Booster


Learn more about
Need a deep-dive on the concept behind this application? Look no further. Learn more about this topic, statistics and related others by exploring similar questions and additional content below.Recommended textbooks for you
Functions and Change: A Modeling Approach to Coll…
Algebra
ISBN:
9781337111348
Author:
Bruce Crauder, Benny Evans, Alan Noell
Publisher:
Cengage Learning

College Algebra
Algebra
ISBN:
9781305115545
Author:
James Stewart, Lothar Redlin, Saleem Watson
Publisher:
Cengage Learning

Elementary Linear Algebra (MindTap Course List)
Algebra
ISBN:
9781305658004
Author:
Ron Larson
Publisher:
Cengage Learning
Functions and Change: A Modeling Approach to Coll…
Algebra
ISBN:
9781337111348
Author:
Bruce Crauder, Benny Evans, Alan Noell
Publisher:
Cengage Learning
College Algebra
Algebra
ISBN:
9781305115545
Author:
James Stewart, Lothar Redlin, Saleem Watson
Publisher:
Cengage Learning
Elementary Linear Algebra (MindTap Course List)
Algebra
ISBN:
9781305658004
Author:
Ron Larson
Publisher:
Cengage Learning
