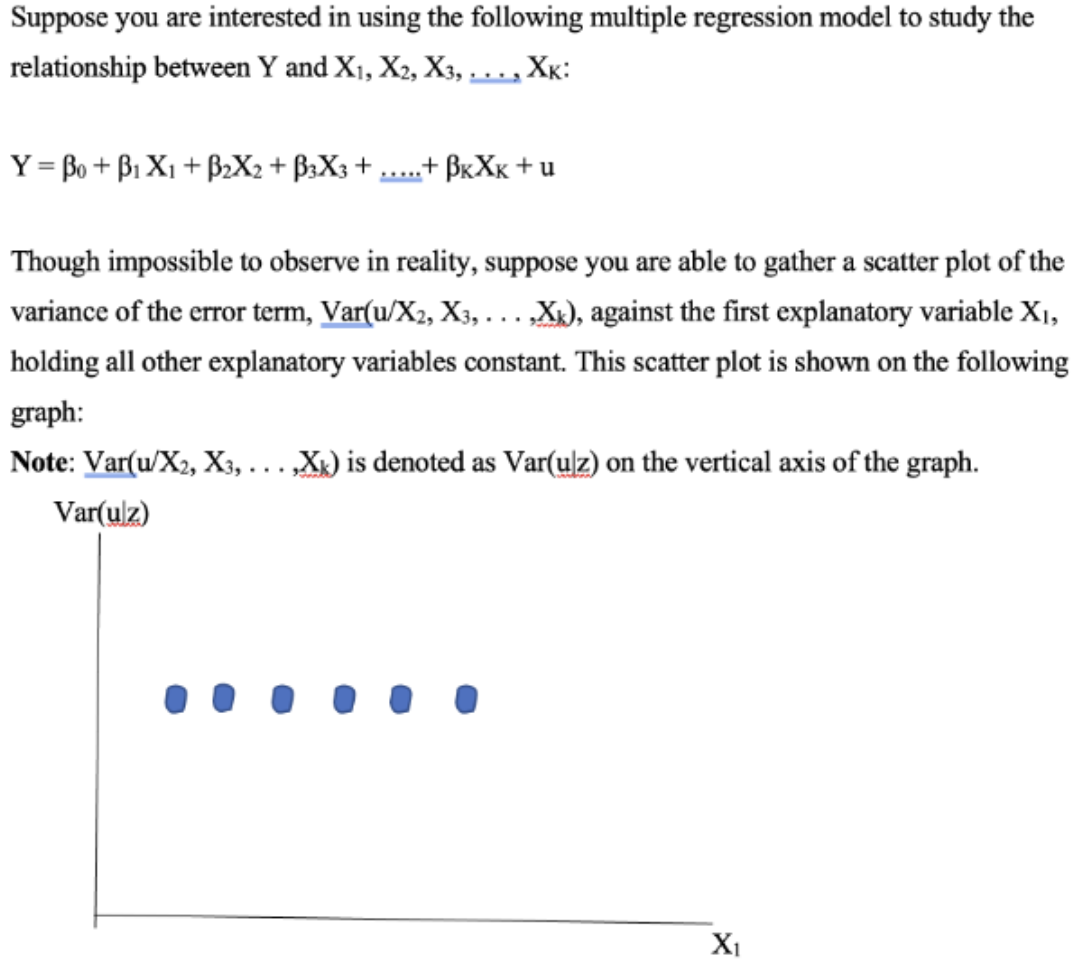
Is there evidence to suggest the model suffers from heteroskedasticity? Yes or no.


Q: If A and B are independent events, show that A' and B are also independent. [Hint: First establish a…
A: We have given that events A and B are independent.As A and B are independent we have the following…
Q: For each statement, express the null hypothesis ?0H0 and alternative hypothesis ?1H1 in symbolic…
A: The objective of the question is to identify the correct null and alternative hypotheses for the…
Q: A high school wants to determine if the average THC in baseline group is less than 4.2 ng/ml at…
A: From the information, given thatthe claim is to test whether the average THC in baseline group is…
Q: Suppose that the probability that a passenger will miss a flight is 0.0937. Airlines do not like…
A: Solution-:Given: The that a passenger will miss a flight is 0.0937 and n=54We want to find,(a) If…
Q: Analyze Filling Line Problems Using Control Charting Attached Files: File Filling line example for…
A: Given the data asSample #8am9am10am11amnoon1pm2pm3pm4pm5pm…
Q: A survey of 100 fatal accidents showed that 39 were alcohol related. Find a point estimate for p,…
A: The objective of this question is to find the point estimate for p, the population proportion of…
Q: The effectiveness of a blood- pressure drug is being investigated. An experimenter finds that, on…
A: Given,To estimate a 98% confidence interval.
Q: What does “statistical significance” mean?
A: "Statistical significance" is a term used in statistics to indicate whether an observed effect or…
Q: Female mean SE median mode SD Sample var Kurtosis skewness range min max sum count Male 7.238095…
A: To determine outliers, one common method is to use the interquartile range (IQR). Outliers are…
Q: You may need to use the appropriate appendix table or technology to answer this question. A group…
A:
Q: Traditional Students (G1) Online Students (G2) mean 2.97 2.95 standard deviation 0.34 0.35 sample…
A: Let X1 be the traditional students and X2 be the online students.Given,.
Q: Based on the regression output below, which of the following are correlated with satisfaction (using…
A: We have given a correlation table for 4 variables such as satisfaction, fresh food, excellent food…
Q: 1. What is the best chart category? 2. What is the best chart subcategory? 3. What is the best chart…
A: Given various chart types for representing Conceptual (Qualitative) and Data-Driven (Quantitative)…
Q: A 2010 survey asked 870 randomly sampled registered voters in California "Do you support? Or do you…
A: (a)Total number of college graduates n1=435Number of college graduates not having an opinion because…
Q: State the null and alternative hypotheses for the situation described below for a statistical test.…
A: Given claim:Testing to see if there is evidence that the mean time spent studying per week is…
Q: Assume that a sample is used to estimate a population proportion p. Find the 99.9% confidence…
A: The question is about confidence interval.Given :Total no. of observations in the sample ( n ) =…
Q: Provide the null and alternative hypotheses used to address these problems. Make sure that your…
A: It is needed to find the null and alternative hypotheses.
Q: Calculate d¯�¯ and sd�� for the following set of paired data. Calculate each paired difference by…
A: Group AGroup B2522232520202526172318211619292629281720
Q: this was a duplicate
A: The random sample of size, The mean of the distribution, inchesThe standard deviation of the…
Q: An oil exploration company currently has two active projects, one in Asia and other in Europe. Let A…
A: A and B are two independent events with P(A)=0.3 and P(B)=0.9, where P(A) denotes the probability…
Q: A USA Today snapshot shows that men and women feel differently about driving in winter conditions,…
A: The sample size of men is n1=500The sample size of women is n2=400The sample proportion is donated…
Q: 2. Engineer Salaries: Employees at a battery company claim that the mean salary of the company's…
A: The hypothesized average salary (in $) of the company's mechanical engineers, μ0=90000.The sampled…
Q: A random sample of n = 49 observations is drawn from a population with a mean equal to 24 and a…
A: From the provided information,
Q: Find the coefficients for the least-squares regression line ?̂=?0+?1?y^=b0+b1x through the points…
A: The objective of this question is to find the coefficients b0 and b1 for the least-squares…
Q: n a study to determine whether counseling could help people lose weight, a sample of people…
A: The formula of the test statistic is,where, denotes the sample means denotes the sample standard…
Q: Suppose X follows an exponential distribution with parameter A, then P(X ≤ 1|X ≤ 2) = e-^. (b) For a…
A: Given that X follows exponential distribution with parameter . Then the CDF of X is given as:F(x) =…
Q: What is an example research project in which a one-sample Z-test would be appropriate? Write out, in…
A: z-test:For large sample sizes almost all distributions Binomial, Poisson, Negative Binomial,…
Q: Suppose babies bom after a gestation period of 32 to 35 weeks have a mean weight of 2800 grams and a…
A: After a gestation period of 32 to 35 weeksPopulation mean, Population standard deviation, After a…
Q: According to a study done by Nick Wilson of Otago University Wellington, the probability a randomly…
A: Sample of size(n)=12and p=0.267A random variable XBinomial(n=12 , p=0.267)P(X=x)=
Q: The mean output of solar cells of three types are measured six times under random light intensity…
A: The question is about ANOVA.Given :To find :Is the mean solar cell output the same for all cell…
Q: Examine the table and graph below. Explain which main effect(s) and interaction effect(s) you see in…
A: Given is an interaction plot for the two independent variables.
Q: K When purchasing bulk orders of batteries, a toy manufacturer uses this acceptance sampling plan:…
A: "Since you have posted multiple questions we will provide solutions only to the first question as…
Q: technology results, and using a 0.01 significance level, test the claim that vinyl gloves have a…
A: Given data in the problem isn1 = 258n2 = 258p1 = 0.67p2 = 0.08We have to calculate test statistics
Q: a) what type of variable is a subjects before blood pressure (in mmHg) b) Describe the form and…
A: Let X be before blood pressure and Y: be after blood pressure.Data is given…
Q: If n=21, (x-bar)=32, and s=18, construct a confidence interval at a 80% confidence level. Assume the…
A: The given values area and . The confidence level is 80%.
Q: Assume that a sample is used to estimate a population proportion p. Find the 98% confidence interval…
A: Sample size(n)=228No. of successes(x)=173confidence level=98%sample proportion()=
Q: The daily sleep duration among college students was approximately Normally distributed with mean µ =…
A: Let X be the daily sleep duration for college students. µ = 7.13 hours and standard deviation σ =…
Q: A 2010 survey asked 870 randomly sampled registered voters in California "Do you support? Or do y…
A: Hello! As you have posted more than 3 sub-parts, we are answering the first 3 sub-parts. In case…
Q: In order to examine the relationship between the selling price of a used car and its age, an analyst…
A: The regression results are given as follows: CoefficientsStandard errort…
Q: 1- A box contains four tickets with numbers 1, 1, 2, 3. Draw two tickets at random with replacement,…
A: a) To write the joint mass probability function, we need to consider all possible outcomes for X and…
Q: According to a travel website, workers in a certain country lead the world in vacation days,…
A: The question is about a confidence interval.Given :Population mean no. of vacation days ( ) = 22.91…
Q: pound that the human nose can detect. The odor threshold for dimethyl sulfide (DMS) in trained wine…
A: Population standard deviation=8Margin of error=E=0.1
Q: When people learn a new task, their performance usually improves when they are tested the next day,…
A: Given that : 6 hours sleepNo sleepn =14n = 14M = 72M = 65SS = 932SS = 706Claim : When people learn a…
Q: A post office is run by two clerks. When Smith enters the system, he finds that Jones is being…
A: A post office is run by two clerks. When Smith enters the system, he finds that Jones is being…
Q: Tinker Air Force Base wants to calibrate some scales that it uses in a particular maintenance…
A: The sample size, i.e., the considered number of scales, n=50.The sampled number of scales that are…
Q: A company produces steel rods. The lengths of the steel rods are normally distributed with a mean of…
A: According to guidline we are supposed to solve first three subparts only ,rest can be asked again by…
Q: A person's blood glucose level and diabetes are closely related. Let x be a random variable measured…
A: Solution
Q: Match each statement regarding the z-scores of the x and y scores (Zx and Zy) from a scatterplot to…
A: Given the direction of the z-scores of two variables X and Y. It is required to compare these…
Q: An electronic system has one each of two different types of components in joint oper- ation. Let Y₁…
A: According to guidlines we are supposed to solve first three subparts only and rest can be…
Q: A film distribution manager calculates that 6 % of the films released are flops. If the manager is…
A: This is the situation of binomial distribution where the probability of success is 0.06 and n=…
Is there evidence to suggest the model suffers from heteroskedasticity? Yes or no.

Step by step
Solved in 3 steps with 1 images

- Olympic Pole Vault The graph in Figure 7 indicates that in recent years the winning Olympic men’s pole vault height has fallen below the value predicted by the regression line in Example 2. This might have occurred because when the pole vault was a new event there was much room for improvement in vaulters’ performances, whereas now even the best training can produce only incremental advances. Let’s see whether concentrating on more recent results gives a better predictor of future records. (a) Use the data in Table 2 (page 176) to complete the table of winning pole vault heights shown in the margin. (Note that we are using x=0 to correspond to the year 1972, where this restricted data set begins.) (b) Find the regression line for the data in part ‚(a). (c) Plot the data and the regression line on the same axes. Does the regression line seem to provide a good model for the data? (d) What does the regression line predict as the winning pole vault height for the 2012 Olympics? Compare this predicted value to the actual 2012 winning height of 5.97 m, as described on page 177. Has this new regression line provided a better prediction than the line in Example 2?In a typical multiple linear regression model where x1 and x2 are non-random regressors, the expected value of the response variable y given x1 and x2 is denoted by E(y | 2,, X2). Build a multiple linear regression model for E (y | *,, *2) such that the value of E(y | x1, X2) may change as the value of x2 changes but the change in the value of E(y | X1, X2) may differ in the value of x1 . How can such a potential difference be tested and estimated statistically?A “Cobb–Douglas” production function relates production (Q) to factorsof production, capital (K), labor (L), and raw materials (M), and an errorterm u using the equation Q = λKβ1Lβ2Mβ3eu, where λ, β1, β2, and β3 areproduction parameters. Suppose that you have data on production and thefactors of production from a random sample of firms with the same Cobb–Douglas production function. How would you use regression analysis toestimate the production parameters?
- In running a regression of the retunrs of stock XYZ against the returns on the market, the Std for the returns of stock XYZ is 20% and that of the market returns is 15%. If the estimated beta is found to be 0.75 : What is the maximum possible value of beta given that the standar deivation of the returns of stock XYZ is 20% and those of the market is 15% ?An econometrician suspects that the residuals of her model might be autocorrelated. Explain the steps involved in testing this theory using the Durbin–Watson (DW) testUse the following results obtained from a simple linear regression analysis with 12 observations. Y = 37.2895- (1.2024)X Sb = 0.2934 Test to determine if there is a significant negative relationship between the independent and dependent variables at alpha= .05. Give the resulting conclusion. a. is rejected. B.cannot be tested with the given information. c. is not rejected. D. is not an appropriate null hypothesis for this situation.
- In the following model, "employed" is a dummy indicating a person is employed: donation = B + B edu + Bemployed + uT Running this model will produce the same results of differential in donation between employed people and unemployed people as running two separate regressions for employed people and unemployed people. A. True B. FalseGiven the residuals squared derived from the regression: Marks = ƒ(Study hours) Use the information from the following auxiliary regression (table attached) to conduct the Park test to detect for the presence of heteroscedasticity at a = 5%.The following estimated regression model was developed relating yearly income (y in $1000s) of 30 individuals with their age (x1) and their gender (x2) (0 if male and 1 if female).ŷ = 30 + 0.7x1 + 3x2Also provided are SST = 1200 and SSE = 384.The yearly income of a 24-year-old female individual is _____.
- Which of the following does not need to be computed to determine a simple regression line? SSx SP "Y-hat" SSyConsider the following correlations -0.9 , -0.5 , -0.2 , 0 , 0.2 , 0.5 and 0.9. For each give the fraction of the variation in y that is explained by the least-squares regression of y on x.A researcher would like to predict the dependent variable YY from the two independent variables X1X1 and X2X2 for a sample of N=10N=10 subjects. Use multiple linear regression to calculate the coefficient of multiple determination and test statistics to assess the significance of the regression model and partial slopes. Use a significance level α=0.01α=0.01. X1X1 X2X2 YY 58.8 29.9 63.1 64.1 57.3 40.1 51.4 35.3 46.2 77.1 88.5 30 60.6 67.5 16.2 68.3 63.4 62 44.8 6.6 77.6 49 29.3 65.5 55.5 25.8 62.5 57.5 30.2 62 R2=R2= F=F= P-value for overall model = t1=t1= for b1b1, P-value = t2=t2= for b2b2, P-value = What is your conclusion for the overall regression model (also called the omnibus test)? The overall regression model is statistically significant at α=0.01α=0.01. The overall regression model is not statistically significant at α=0.01α=0.01. Which of the regression coefficients are statistically different from zero? neither regression coefficient is…
