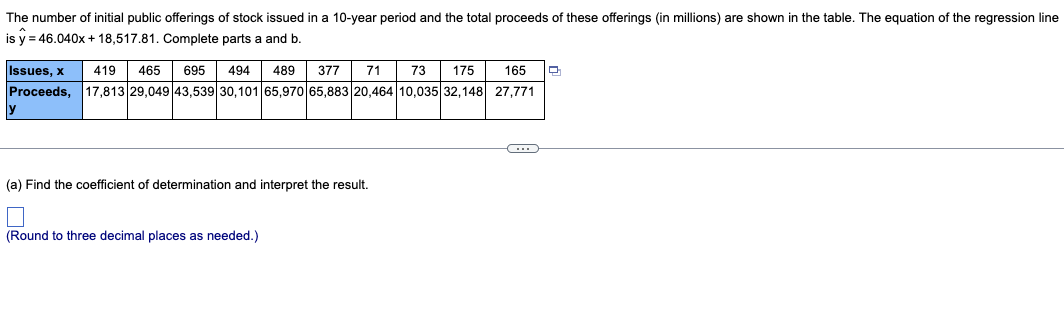
is y = 46.040x + 18,517.81. Complete parts a and b. Issues, x 419 465 695 494 489 377 71 73 175 165 Proceeds, 17,813 29,049 43,539 30,101 65,970 65,883 20,464 10,035 32,148 27,771 (a) Find the coefficient of determination and interpret the result. (Round to three decimal places as needed.)


Q: Definitions. Define each of the following concepts. Where relevant, be sure to say what each is…
A: Given that We have to define a.. Expected Cell Frequencies: b) Scatterplot:
Q: A game is player with a pair of tetrahedral ( four sided) dice. Each die has four faces numbered…
A: if a pair 4 sided die is rolled than the possible outcomes…
Q: The OLS regression of P, on Z, for t = 1, ., 104 gives P = -3.01 – 0.74Z,, R = 0.31, SER = 3.66.…
A: From the given information, Pt on Zt for t=1,....,104 regression was constructed. The OLS regression…
Q: H0: u1=u2=u3=u4 --------- claim or not? H1: At least one mean is different from the…
A:
Q: Which is not a step in hypothesis testing? A. Determine or establish alpha B. Determine or…
A: Here's, in the hypothesis testing, we find beta, find the critical value, calculate test statistic.
Q: A normal distribution has a mean of 134 and a standard deviation of 3. Find the z-score for a data…
A: According to the given information in this question We need to find the z score value
Q: Given r=0.83, find the coefficients of determination and nondetermination and explain the meaning of…
A: Coefficient of determination is known as R -squared.
Q: SHOW COMPLETE SOLUTION The average number of field mice per acre in a 5-acre wheat field is…
A:
Q: e following data represent the number of people aged 25 to 64 years covered by health insurance…
A: Given The following data represent the number of people aged 25 to 64 years covered by health…
Q: A new cataracts removal procedure for persons older than 60 years of age with degrading vision from…
A: "Since you have posted a question with multiple subparts, we will solve first 3 sub-parts for you.…
Q: 1. The joint density for the random variables (X, Y) is given below. for 0SaS1,0SUSI for chsewhere…
A: Since you have posted a question with multiple sub-parts, we will solve first three subparts for…
Q: Consider that the variables X and Y have the following joint probability distribution. S(z,y) 0.05…
A: XY 1 2 3 Total 1 0.05 0.05 0.10 0.2 3 0.05 0.10 0.35 0.5 5 0.00 0.20 0.10 0.3 Total 0.1…
Q: A researcher reports an F-ratio with df = 3, 36 from an independent-measures research study. Based…
A: Given: F ratio with df=3,36
Q: A population of values has a normal distribution with u = 26.4 and o = 50.3. You intend to draw a…
A:
Q: An article in the Journal of the American Ceramic Society, "Rapid Hot-Pressing of Ultrafine PSZ…
A: The provided information is x y xy x2 1100 30.8 33880 1210000 1200 19.2 23040 1440000 1300…
Q: You have a theory: people who have a high income (X) are generally healthier (Y). You collect some…
A: Here statement is given Correlation between income and health (positive correlation) But there is…
Q: Assume that there is a positive linear correlation between the variable R (return rate in percent of…
A: Given information: No. of variables=02 Variables under study: 1. Return rate in Percent of a…
Q: Which value of r indicates a stronger correlation: r= 0.841 orr= - 0.949? Explain your reasoning.…
A:
Q: A group of students practiced a series of trials at a shooting range. Their scores are plotted in…
A: The difference score of the group is obtained below: Difference=Group 2-Group 1=4-2=2
Q: From the data we find that Sxx = 0.11273, Syy = 11,807,324,805, Sxy = 34,422.28. n=29, test the null…
A: The question is based on testing of correlation coefficient Given : Significance level ( α ) = 0.05…
Q: The table below shows the total population in the selected cities. Population 10,000 - <25,000…
A: Note: "Since you have posted a question with multiple sub -parts, we will solve first three sub…
Q: Construct a frequency distribution table with seven classes for the scores below. Determine the…
A: Measure of central tendency are used to summarize the data. There are five measure in the central…
Q: Assume that 14%of parts in a manufacturing line are defective. If 4 parts are selected at random,…
A: “Since you have posted a question with multiple sub-parts, we will solve the first three subparts…
Q: An article in the Journal of Sound and Vibration (Vol. 151, 1991, pp. 383-394) described a study…
A: For the given data Find Slope =?
Q: 3. Let X,..X, be random sample from the probability density function S(x| 4) =e, where -o< u<x<0.…
A: Given that Let X be random sample from the probability density function f(x)=e, where…
Q: a) Estimate the intercept Bo and slope B1 regression coefficients. Write the estimated regression…
A: Since you have posted a question with multiple sub-parts, we will solve first three sub- parts for…
Q: IDENTIFY IF IT IS| ONE-TAILED LEFT TEST, ONE-TAILED RIGHT, NONE-TAILED, TWO-TAILED Given: n = 8 x =…
A:
Q: reasing size needs to be moved from a start peg to a goal peg using a middle peg as rmediate storage…
A:
Q: Zoologists investigated the reproductive traits of spider mites with an infection. Male and female…
A: Hello! As you have posted more than 3 sub parts, we are answering the first 3 sub-parts. In case…
Q: To evaluate effectiveness of a processor for a certain type of tasks, we recorded the CPU time for n…
A: Given that To evaluate effectiveness of a processor for a certain type of tasks, we recorded the…
Q: The distribution of heights of adult men is approximately normal with mean 69 inches and standard…
A: As per the Bartleby guildlines we have to solve first three subparts and rest can be reposted....…
Q: Construct a frequency distribution table with seven classes for the scores below. Determine the…
A: Data is given We have to construct frequency table, Histogram, frequency polygon, cumulative…
Q: The number of home runs in a baseball game is assumed to have a Poisson distribution with a mean of…
A: A discrete random variable X is said to follow Poisson distribution with parameter λ, if its…
Q: Find the range and standard deviation. The table below gives the number of hours spent watching TV…
A: Introduction: There are four types of Measures of dispersion Range Standard deviation Mean…
Q: Approximately, what percent of the students scored within A.0 1 standard deviation of the mean? B 1…
A: Since you posted a question with multiple subparts, we will solve first three subparts for you. To…
Q: The formula for a regression line is y = a + bx For the regression equation shown below (assume…
A: The question is based on a regression Given reg. eq : average monthly sales = 126 + 172 *…
Q: 8. A researcher has exam result for students who took a training course for a national exam. The…
A:
Q: 3. The constant of a regression of Y on X is 4. The residual for the first observation in the table…
A: For the given data, we need to find the constant of a regression of Y on X and residual for the…
Q: You sampled 13 people and got their pre-diet weight and post-diet weight. If α=.05α=.05, the test…
A:
Q: When creating a confidence interval, the larger the confidence level required, A. The narrower…
A: Here's, when creating a confidence interval, for larger confidence level required.
Q: The accompanying data represent the miles per gallon of a random sample of cars with a…
A: so , mean = 38.867 standard deviation =3.374
Q: Using the standard normal distribution, find the two z-scores that that form the middle shaded…
A:
Q: 4. O Suppose a company has-100 employees and 40 of them have completed a training program. If we…
A: Given Information: 40 out of 100 employees have completed a training program. Sample size is 10.
Q: Today, the waves are crashing onto the beach every 5.6 seconds. The times from when a person arrives…
A:
Q: A grocery store manager did a study to look at the relationship between the amount of time (in…
A: a. The correlation coefficient is x y xy x2 y2 25 93 2325 625 8649 29 80 2320 841 6400 25…
Q: Using the information from the last question about Izzy and Hannah: 1. Write a pair of null and…
A: Since you have posted a question with multiple sub-parts, we will solve first three subparts for…
Q: Question 20 The following regression relating wages and years of education is estimated: Wage = 8.5…
A: The t – test statistic of slope estimate would be used to detect the correlation between two…
Q: An article in the ACI Materials Journal (Vol. 84, 1987, pp. 213-216) describes several experiments…
A:
Q: and not 7. The measurements of the drying time, in hours, of a certain brand of latex paint follow a…
A: Confidence interval are used to measure the range where the parameter lies. It can be calculated for…
Q: 1. The joint density for the random variables (X, Y) is given below. for 0SaS1,0Sy SI for clsewhere…
A:

Step by step
Solved in 3 steps

- Olympic Pole Vault The graph in Figure 7 indicates that in recent years the winning Olympic men’s pole vault height has fallen below the value predicted by the regression line in Example 2. This might have occurred because when the pole vault was a new event there was much room for improvement in vaulters’ performances, whereas now even the best training can produce only incremental advances. Let’s see whether concentrating on more recent results gives a better predictor of future records. (a) Use the data in Table 2 (page 176) to complete the table of winning pole vault heights shown in the margin. (Note that we are using x=0 to correspond to the year 1972, where this restricted data set begins.) (b) Find the regression line for the data in part ‚(a). (c) Plot the data and the regression line on the same axes. Does the regression line seem to provide a good model for the data? (d) What does the regression line predict as the winning pole vault height for the 2012 Olympics? Compare this predicted value to the actual 2012 winning height of 5.97 m, as described on page 177. Has this new regression line provided a better prediction than the line in Example 2?Find the equation of the regression line for the following data set. x 1 2 3 y 0 3 4If your graphing calculator is capable of computing a least-squares sinusoidal regression model, use it to find a second model for the data. Graph this new equation along with your first model. How do they compare?
- The number of initial public offerings of stock issued in a 10-year period and the total proceeds of these offerings (in millions) are shown in the table. The equation of the regression line is y=47.271x+18,712.47. Issues, x Proceeds, y425 18,758468 29,602678 43,797478 31,661485 65,518396 65,33069 21,42764 11,847181 32,392157 27,561 Complete parts a and b. The number of initial public offerings of stock issued in a 10-year period and the total proceeds of these offerings (in millions) are shown in the table. The equation of the regression line is y=47.271x+18,712.47. Complete parts a and b. (a) Find the coefficient of determination and interpret the result. (Round to three decimal places as needed.) (b) Find the standard error of estimate se and interpret the result. (Round to three decimal places as needed.)The number of initial public offerings of stock issued in a 10-year period and the total proceeds of these offerings(in millions) are shown in the table. The equation of the regression line is y=47.538x+18,727.65. Complete parts a and b. Issues, x Proceeds, y 423 18,632 460 27,913 687 44,071 485 32,435 500 66,634 389 66,734 57 22,180 65 11,296 188 31,929 163 27,891 (a) Find the coefficient of determination and interpret the result. How can the coefficient of determination be interpreted? (b) Find the standard error of estimate se and interpret the result. How can the standard error of estimate be interpreted?The number of initial public offerings of stock issued in a 10-year period and the total proceeds of these offerings (in millions) are shown in the table. Construct and interpret a 95% prediction interval for the proceeds when the number of issues is 569.The equation of the regression line is y=32.409x+17,285.501. Issues, x 410 467 679 499 497 394 62 53 189 174 Proceeds, y 18,223 28,066 43,757 31,337 35,488 35,312 22,180 10,660 30,384 28,416 Construct and interpret a 95% prediction interval for the proceeds when the number of issues is 569. Select the correct choice below and fill in the answer boxes to complete your choice. (Round to the nearest million dollars as needed. Type your answer in standard form where "3.12 million" means 3,120,000.) A. There is a 95% chance that the predicted proceeds given 569 issues is between $____ and $____. B. We can be 95% confident…
- We wish to predict the salary for baseball players (y) using the variables RBI (x1) and HR (x2), then we use a regression equation of the form yˆ=b0+b1x1+b2x2 HR - Home runs - hits on which the batter successfully touched all four bases, without the contribution of a fielding error. RBI - Run batted in - number of runners who scored due to a batters's action, except when batter grounded into double play or reached on an error Salary is in millions of dollars.A statistics professor wants to determine how students' final grades are related to mid-term exam scores, applied in the middle of the term, and the number of classes missed. The teacher selects 10 students from his class and obtains the following data as an attachment. Y = b + m1x1 + m2x2 being the general form of the multiple regression equation referring to the data above. Check the alternative that corresponds to the approximate value of b, m1 and m2, respectively: a) 46,39; 0,54; -4,89 b) -4,89; 0,54; 46,39 c) 46,39; -4,89; 0,54 d) -4,89; 46,39; 0,54The table below shows the number of state-registered automatic weapons and the murder rate for several Northwestern states. xx 11.5 8.2 6.6 3.7 2.9 2.8 2.1 0.4 yy 13.6 11.2 9.3 7.2 6.7 6.4 6 4.3 xx = thousands of automatic weaponsyy = murders per 100,000 residents Use your calculator to determine the equation of the regression line. (Round to 2 decimal places)Determine the regression equation in y = ax + b form and write it below. A) How many murders per 100,000 residents can be expected in a state with 10.5 thousand automatic weapons?Answer = Round to 3 decimal places. B) How many murders per 100,000 residents can be expected in a state with 10.8 thousand automatic weapons?Answer = Round to 3 decimal places.
- A college bookstore must order books two months before each semester starts. They believe that the number of books that will ultimately be sold for any particular course is related to the number of students registered for the course when the books are ordered. They would like to develop a linear regression equation to help plan how many books to order. From past records, the bookstore obtains the number of students registered, X, and the number of books actually sold for a course, Y, for 12 different semesters. These data are below. Show the complete table for your solutions. At a .01 level of significance is there sufficient evidence to conclude that the number of books sold is related to the number of registered students in a straight-line manner? Calculate df:Indicate whether it is a one-tail or two-tail test:Use the table for PEARSON'S CORRELATION COEFFICIENT r (Critical Values):Make a Decision by comparing critical r with the computer Pearson Correlation Coefficient:A county real estate appraiser wants to develop a statistical model to predict the appraised value of houses in a section of the county called East Meadow. One of the many variables thought to be an important predictor of appraised value is the number of rooms in the house. Consequently, the appraiser decided to fit the simple linear regression model: E(y) = β0 + β1x, where y = appraised value of the house (in thousands of dollars) and x = number of rooms. Using data collected for a sample of n = 74 houses in East Meadow, the following results were obtained: = 74.80 + 19.84 xGive a practical interpretation of the estimate of the slope of the least squares line. For a house with 0 rooms, we estimate the appraised value to be $74,800. For each additional room in the house, we estimate the appraised value to increase $74,800. For each additional room in the house, we estimate the appraised value to increase $19,840. For each additional dollar of…The number of initial public offerings of stock issued in a 10-year period and the total proceeds of these offerings (in millions) are shown in the table. Construct and interpret a 95% prediction interval for the proceeds when the number of issues is 646. The equation of the regression line is y=32.824x+17,659.242. Issues, x 418 475 683 477 492 379 59 51 196 154 Proceeds, y 17,703 28,601 43,966 31,686 36,833 36,916 21,908 10,311 31,407 28,337 Construct and interpret a 95% prediction interval for the proceeds when the number of issues is 646. Select the correct choice below and fill in the answer boxes to complete your choice. (Round to the nearest million dollars as needed. Type your answer in standard form where "3.12 million" means 3,120,000.) A. We can be 95% confident that when there are 646 issues, the proceeds will be between $____ and $____. B. There is a 95% chance…


