istribution table Area to the Right of the Critical V 0.995 0.99 0.975 0.95 0.90 0.10 0.001 0.004 0.016 2.706 0.010 0.020 0.051 0.103 0.211 4.605 0.072 0.115 0.216 0.352 0.584 6.251 0.207 0.297 0.484 0.711 1.064 7.779 0.412 0.554 0.831 1.145 1.610 9.236 0.676 0.872 1.237 1.635 2.204 10.645 0.989 1.239 1.690 2.167 2.833 12.017 1.344 1.646 2.180 2.733 3.490 13.362 1.735 2.088 2.700 3.325 4.168 14.684 2.156 2.558 3.247 3.940 4.865 15.987 Print Done
istribution table Area to the Right of the Critical V 0.995 0.99 0.975 0.95 0.90 0.10 0.001 0.004 0.016 2.706 0.010 0.020 0.051 0.103 0.211 4.605 0.072 0.115 0.216 0.352 0.584 6.251 0.207 0.297 0.484 0.711 1.064 7.779 0.412 0.554 0.831 1.145 1.610 9.236 0.676 0.872 1.237 1.635 2.204 10.645 0.989 1.239 1.690 2.167 2.833 12.017 1.344 1.646 2.180 2.733 3.490 13.362 1.735 2.088 2.700 3.325 4.168 14.684 2.156 2.558 3.247 3.940 4.865 15.987 Print Done

Holt Mcdougal Larson Pre-algebra: Student Edition 2012
1st Edition
ISBN:9780547587776
Author:HOLT MCDOUGAL
Publisher:HOLT MCDOUGAL
Chapter11: Data Analysis And Probability
Section: Chapter Questions
Problem 8CR

Related questions
Topic Video
Question
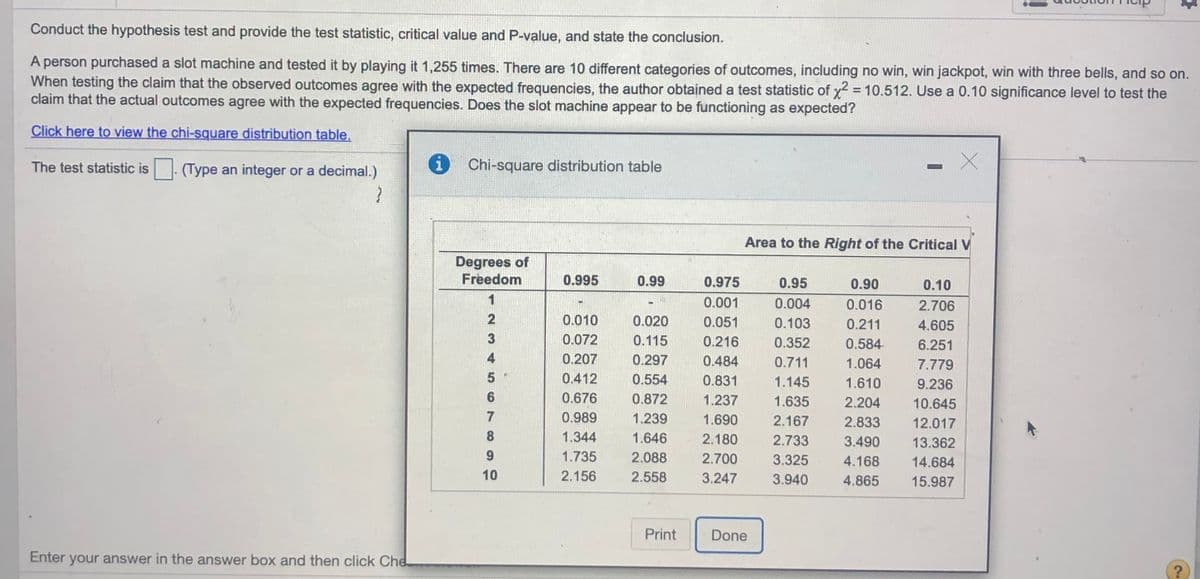
Transcribed Image Text:Conduct the hypothesis test and provide the test statistic, critical value and P-value, and state the conclusion.
A person purchased a slot machine and tested it by playing it 1,255 times. There are 10 different categories of outcomes, including no win, win jackpot, win with three bells, and so on.
When testing the claim that the observed outcomes agree with the expected frequencies, the author obtained a test statistic of x2 = 10.512. Use a 0.10 significance level to test the
claim that the actual outcomes agree with the expected frequencies. Does the slot machine appear to be functioning as expected?
Click here to view the chi-square distribution table.
The test statistic is
(Type an integer or a decimal.)
i Chi-square distribution table
Area to the Right of the Critical V
Degrees of
Freedom
0.995
0.99
0.975
0.95
0.90
0.10
1
0.001
0.004
0.016
2.706
0.010
0.020
0.051
0.103
0.211
4.605
3
0.072
0.115
0.216
0.352
0.584
6.251
0.207
0.297
0.484
0.711
1.064
7.779
5
0.412
0.554
0.831
1.145
1.610
9.236
6
0.676
0.872
1.237
1.635
2.204
10.645
7
0.989
1.239
1.690
2.167
2.833
12.017
8
1.344
1.646
2.180
2.733
3.490
13.362
9.
1.735
2.088
2.700
3.325
4.168
14.684
10
2.156
2.558
3.247
3.940
4.865
15.987
Print
Done
Enter your answer in the answer box and then click Che
Expert Solution
This question has been solved!
Explore an expertly crafted, step-by-step solution for a thorough understanding of key concepts.

Step by step
Solved in 3 steps with 4 images

Knowledge Booster


Learn more about
Need a deep-dive on the concept behind this application? Look no further. Learn more about this topic, statistics and related others by exploring similar questions and additional content below.Recommended textbooks for you
Holt Mcdougal Larson Pre-algebra: Student Edition…
Algebra
ISBN:
9780547587776
Author:
HOLT MCDOUGAL
Publisher:
HOLT MCDOUGAL
Holt Mcdougal Larson Pre-algebra: Student Edition…
Algebra
ISBN:
9780547587776
Author:
HOLT MCDOUGAL
Publisher:
HOLT MCDOUGAL