It is thought that basketball teams that make too many fouls in a game tend to lose the game even if they otherwise play well. Let x be the number of fouls more than (i.e., over and above) the opposing team. Let y be the percentage of times the team with the larger number of fouls wins the game. x 0 4 S 6 33 26 v so 41 50 (b) Verify the given sums Ex, Ey, Ex?, Ey?, Exy, and the value of the sample correlation coefficient r. (Round your value for r to four decimal places.) Ex = Ey = Ex = Ey? Exy =L (c) Find x, and y. Then find the equation of the least-squares line ý = a + bx. (Round your answers to four decimal places.) y (d) Graph the least-squares line. Be sure to plot the point (x, y) as a point on the line. y y 5 55 s0t 50 a a 45 45 40 40 35 35 30 30 25 25 4 6 2 4 6 8 y y 55 50 5 50 45 45 40 40 d 35 35 30 30 25 25 2. 4 (e) Find the value of the coefficient of determination r. What percentage of the variation in y can be explained by the corresponding variation in x and the least-squares line? What percentage is unexplained? (Round your answer for r to four decimal places. Round your answers for the percentages to two decimal place.) 2- explained


Contingency Table
A contingency table can be defined as the visual representation of the relationship between two or more categorical variables that can be evaluated and registered. It is a categorical version of the scatterplot, which is used to investigate the linear relationship between two variables. A contingency table is indeed a type of frequency distribution table that displays two variables at the same time.
Binomial Distribution
Binomial is an algebraic expression of the sum or the difference of two terms. Before knowing about binomial distribution, we must know about the binomial theorem.
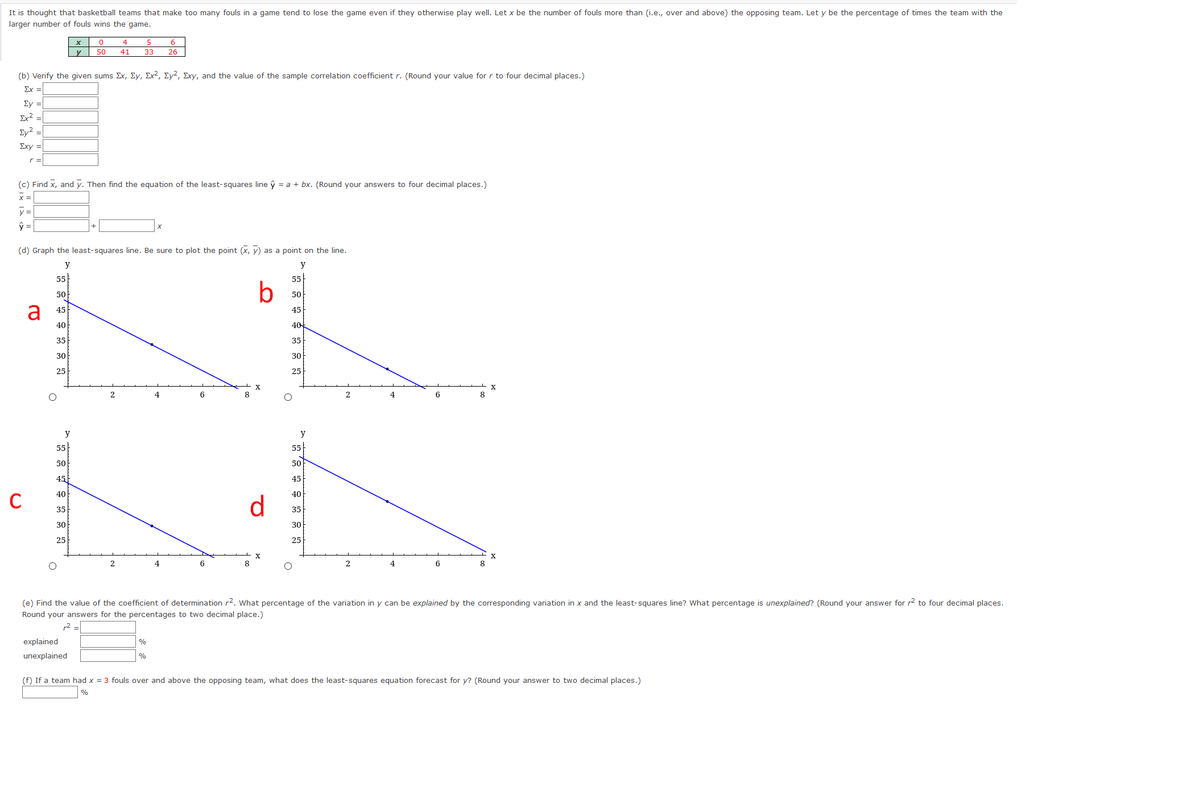
It is thought that basketball teams that make too many fouls in a game tend to lose the game even if they otherwise play well. Let x be the number of fouls more than (i.e., over and above) the opposing team. Let y be the percentage of times the team with the larger number of fouls wins the game.


Trending now
This is a popular solution!

Step by step
Solved in 2 steps with 1 images


