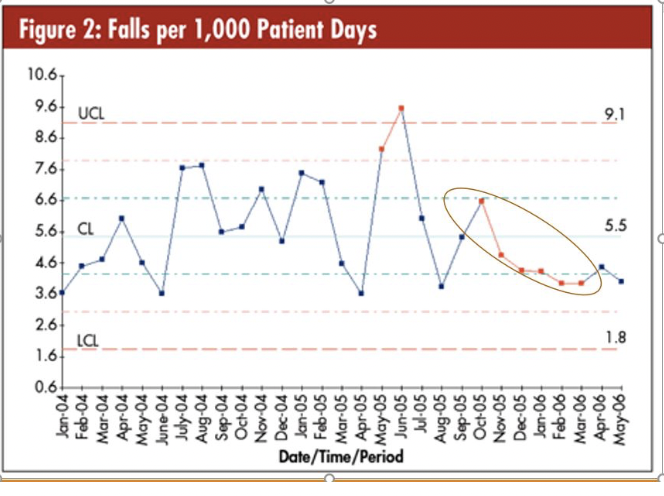
Jan-04 Feb-04 Mar-04 Apr-04 May-04 June-04 Date/Time/Period July-04 Aug-04 Sep-04 Oct-04 Nov-04 Dec-04 Jan-05 Feb-05 0.6 1.6 2.6 Mar-05 Apr-05 May-05 Jun-05 Jul-05- Aug-05 Sep-05 Oct-05 Nov-05 Dec-05 Jan-06 Feb-06 Mar-06 Apr-06 May-06 LCL 1.8 3.6 4.6 5.6 CL f 5.5 6.6 7.6 8.6 9.6 UCL 9.1 10.6


Q: For the dinner special at a restaurant, the customer must choose a salad, an entree, a side dish,…
A: given data, salad:-2entree:-5side dish:-3dessert:-3for the dinner special at a resturant , the…
Q: Certain kinds of tumors tend to recur. The following frequency table represents the lengths of time,…
A:
Q: A pediatrician wants to determine the relation that may exist between a child's height and head…
A: The explanatory variable x denotes the height and the response variable y denotes the head…
Q: Question 14 Given the normally distributed variable X with mean 18 and SD 2.5, find P(17<X) -0.6554…
A: given data, normal distributionμ=18σ=2.5p(17<x)=?p(17<X) means we have to find out the…
Q: In order to fairly set the flat rates for auto mechanics, a shop foreman needs to estimate average…
A: Given information: confidence level is 95%=0.95. sample standard deviation is 34 minutes The average…
Q: 0X 33) Suppose you pay $3.00 to roll a fair die with the understanding that you will get back $5.00…
A: given data pay $ 3 to roll a fair dieif roll 3 or 6 you win $ 5otherwisw nothing expected value =?
Q: A sample of size 50 is selected from a population having a standard deviation equal to 4. Find the…
A: given data population standard deviation(σ) = 490% ci for μ.margin of error(E) = ?
Q: If we reject Ho, we have found: O Evidence that μ = 2 O Evidence that μ<2 O Evidence that x<2 O…
A: The null and alternative hypotheses are: H0: µ=2 Ha: µ<2
Q: Use this data from the HANES5 survey to estimate the average weight of men 18 and over whose heights…
A: Consider that, height is the independent variable (x) and weight is the dependent variable (y).
Q: A soft-drink machine is regulated so that it discharges an average of 200mL per cup. If the amount…
A: given data normal distributionμ = 200σ = 15P(191<x<209) = ?
Q: How is the Polynomial Regression model different from the Simple Linear Regression and Multiple…
A: Here Simple linear regression model has one Dependent and one Independent variable And Multiple…
Q: olve the problem. 10) Scores on a test are normally distributed with a mean of 65.3 and a standard…
A: given data normal distributionpopulation mean(μ) = 65.3population sd(σ) = 10.3find P81 : 81th…
Q: One year, the mean age of an inmate on death row was 40.9 years. A sociologist wondered whether the…
A:
Q: A veterinarian is interested in researching the proportion of men and women cat owners and believes…
A: Given information Level of significance ɑ=0.02, n1=n2=80 Note: According to Bartleby guidelines…
Q: From its founding through 2019, the Hockey Hall of Fame has inducted 281 players. The table below…
A: Hey there! Thank you for posting the question. Since your question has more than 3 parts, we are…
Q: A builder claims that heat pumps are installed in 70% of all homes being constructed today in a…
A: In statistical inference, there are two parts testing of hypothesis and estimation theory. In…
Q: 4. The following data set shows the number of days a sample of Covid patients reported a…
A:
Q: Using the result from part#1 and the derivations in Q3 from the midterm exam show that the exact…
A:
Q: Question 12 A soft-drink machine is regulated so that it discharges an average of 200mL per cup. If…
A: Given that, a soft-drink machine is regulated so that it discharges an average of 200mL per cup and…
Q: or a particular brand of TV picture tube, it is known that the mean operating life of the tubes is…
A: given data, μ=9000σ=500n=25standard error of the sampling distribution of mean =?
Q: Calculate the CORR(Beer, Diapers) and if you show they aren't correlated, you'll win that bet you…
A: Correlation is the measure of association between two numerical values. It explain the strength of…
Q: Events A, B, and C occur with respective probabilities 0.27, 0.54, and 0.38. Event C is independent…
A: Solution-: Given that: P(A)=0.27, P(B)=0.54, P(C)=0.38, P(B∩A)=0.22 We want to find P(B∪A∪C)=?
Q: f X~N(196,20), find x such that Pr(X < x) = 0.563.
A: given data X~N(196,220) normal distribution with mean =196 and standard deviation = 20 P(x<X) =…
Q: Consider the two questions shown below. (a) Out of apples, oranges, bananas, and pears, which fruit…
A:
Q: Find the value of the combination. 4C3
A:
Q: In a recent survey, 20 people from Ventura were asked how long it took to commute to various work…
A:
Q: A local high school has both male and female students. Each student either plays a sport or doesn't.…
A: sport no sport total male 12 8 20 female 20 10 30 total 32 18 50
Q: II. PROBLEM SOLVING. Solve the following problems. For computations, show all pertinent solutions.…
A: Scatter plot is the graphical representation of the relationship between two variables of a…
Q: Y = 100 + 3x + epsilon, with sigma = 5 For X = 2, find the Z-score for Y = 128 (Show 1 decimal…
A:
Q: Given the normal distribution resulting a probability value of 0.25 by integrating the normal curve…
A: A continuous random variable X is said to follow Normal distribution with parameters μ and σ2 if its…
Q: John threw a dart at the dart board. He got a bull's-eye 8 time out of 30. This is an example of…
A: Solution-: John threw a dart at the dart board. He got a bull's-eye 8 time out of 30. This is an…
Q: I am asking for help on the final 3 bullets points starting with: "State whether the results..." and…
A: Given that: Rats in tunnel (subway): n1=97x¯1=29.1s1=2.7 Rats above ground: n2=76x¯2=28.3s2=2.4
Q: 8. Suppose the scientists have collected the following data: n = 6 m = 11 0.0003 0.0001 Is there…
A: Given information: The claim is that the Webb space telescope has smaller measurement error compared…
Q: Researchers were interested in assessing whether stress levels are different at the beginning of the…
A: The t test are used to compare the mean significance between the sample and population. It can…
Q: 1. In a random sample of fishes from a pond, the mean tail length was 6.0 mm and the reference tail…
A: Since you have asked multiple questions, we will solve the first question for you. If you want any…
Q: The following sample of observations was randomly selected. x 5 3 6 3 4 4 6 8 y 13 15 7 12 13 11 9…
A: Given The data is as follows: x 5 3 6 3 4 4 6 8 y 13 15 7 12 13 11 9 5
Q: As suggested in your assigned readings this week, researchers in psychology who are attempting to…
A: Researchers in psychology who are attempting to make a causal claim typically prioritise internal…
Q: Mr. William Profit is studying companies going public for the first time. He is particularly…
A: Introduction: The size of the offering is being used to predict the price per share, so that the…
Q: The below table shows the probabilities generated by rolling one die 50 times and noting the up…
A: Given that probability distribution table is. X 1 2 3 4 5 6 P(x) 0.22 0.10 0.18 0.12 0.18 0.20
Q: For the advertised price and number of miles data, the equation of the regression line price =…
A: given data regression line : price = 18773-86.18(thousands of miles)predict the asking price for a…
Q: A sample of size n = 10 is drawn from a population. The data is shown below. 98.2 72.8 72.8 107.7…
A: Given that data 98.2 72.8 114.4 107.7 114.4 114.4 80.7 95.8 83.3 93.2
Q: The data below represent commute times (in minutes) and scores on a well-being survey. Complete…
A: From given data we have : X Y 5 69.1 15 68 30 66.5 35 66.3 60 64.5 72 64.3 105 61.3…
Q: suppose a researcher is interested in examining life satisfaction among divorced couples for this he…
A: Introduction: It is required to determine whether the samples are independent or dependent.
Q: The length of time which guitar strings made by a certain company last before breaking is…
A: Given mean is 30 and standard deviation is 6.
Q: Show complete solutions, show ALL the steps in the hypothesis testing. here are the steps for…
A: Followings are the Explanation of the question Use the Excel and Find the Sample Mean and Sample…
Q: A sample of 36 different payroll departments found that the employees worked an average of 242.5…
A: given data sample size (n) = 36sample mean ( x¯ ) = 242.5sample standard deviation (s) =21.295% ci…
Q: onsider the following random sample of data: -9, 1, 9, 9, 7, 2, 10, 5, 82 What is the mean of the…
A: We have given that data . 8, -9, 1, 9, 9, 7, 2, 10, 5, 82 Sample size n =10
Q: Refer to the IEEE International Conference on Web Intelligence and Intelligent Agent Technology…
A: a) The tweet rate can be denoted by x1 and PN-ratio can be denoted by x2.
Q: smoke), 131 people in the 23-30 age bracket (36 of whom smoke), and 99 people in the 31-40 age…
A:
Q: Table 1. Results of the regression analyses. Paradigm Language production Visuospatial memory p≤.10;…
A: If Y is the response variable with X being the explanatory variable, then the regression equation…
Analyzing the data points circled, performance variation is likely attributed to the violation of which control chart criteria?
A) 8 points in a row below Center Line (CL)
B) 4 or 5 points between +1 σ and +2 σ
C) 4 or 5 points between -1 σ and -2 σ
D) One point below Lower Control Limit (LCL)

Step by step
Solved in 2 steps

- SeriesXobservations (ordered from first to fifth/final observation):27,31,29,33,40Based on Series X, the naive forecast for period 6 would be________ while the three-period moving average forecast for period 6 would be_______ 40;34 40;32 32;40 34;40 (Don't hand writing solution)Suppose a company charges a premium of $150 per year for an insurance policy for storm damage to roofs. Actuarial studies show that in case of a storm, the insurance company will pay out an average of $8000 for damage to a composition shingle roof and an average of $12,000 for damage to a shake roof. They also determine that out of every 10,000 policies, there are 7 claims per year made on composition shingle roofs and 11 claims per year made on shake roofs. What is the company’s expected value (i.e., expected profit) per year of a storm insurance policy? What annual profit can the company expect if it issues 1000 such policies? Determine the probability of a composition shingle roof claim out of 10,000 = ______ Determine the probability of a shake roof claim out of 10,000 = ______ How many claims are made out of 10,000? = _______ What is the probability of no claims out of 10,000? = _______ How much does each shingle roof claim cost the company, don’t forget each person pays $150…If the national economy shrank at an annual rate of 6% per year for three consecutive years, then the economy shrank by 18% over the three-year period. The statement is false because each year is a different reference value. The economy actually shrank ____ % over the three-year period.
- In winter of a country, it rains 45% of the days and shine 55% of the days. Mr. X has abarometer which wrongly predicts 5% of the time in rainy days and 10% on shiny days.Mr. X does not carry umbrella if barometer predicts shine. On good shiny morning inwinter, his barometer predicts “shine” and he does not carry umbrella. What is theprobability that Mr. X will suffer from rain on that day.A company is considering a project which has three options. The payoffs are shown in the body of thetable. In this instance, the payoffs are in terms of present values, which represent equivalent currentdollar values of expected future income less costs. This is a convenient measure because it places allalternatives on a comparable basis. If a small facility is built, the payoff will be the same for all threepossible states of nature. For a medium facility, low demand will have a present value of $7 million,whereas both moderate and high demand will have present values of $12 million. A large facility willhave a loss of $4 million if demand is low, a present value of $2 million if demand is moderate,and a present value of $16 million if demand is high.The payoff table depicting revenues and is shown in the following table. (a) Which alternative should the manager choose under the maximax criterion? (b) Which option should the manager choose under the maximin criterion? (c) Which option…An Internet advertising agency is studying the number of "hits" on a certain web site during an advertising campaign. It is hoped that as the campaign progresses, the number of hits on the web site will also increase in a predictable way from one day to the next. For 10 days of the campaign, the number of hits × 105 is shown. Original Time Series Day 1 2 3 4 5 6 7 8 9 10 Hits × 105 1.2 3.5 4.4 7.3 6.7 8.1 9.0 11.2 13.1 14.8 (a) To construct a serial correlation, we use data pairs (x, y) where x = original data and y = original data shifted ahead by one time period. Construct the data set (x, y) for serial correlation by filling in the following table. x 1.2 3.5 4.4 7.3 6.7 8.1 9.0 11.2 13.1 y (b) For the (x, y) data set of part (a), compute the equation of the sample least-squares line ŷ = a + bx. (Use 4 decimal places.) a b If the number of hits was 9.3 (× 105) one day, what do you predict for the number of hits the next…
- A project requires an initial outlay of $92000 and produces a return of $30000 at the end of year 1, $40000 at the end of year 2, and $42xyz at the end of year 3, where x, y, z are the last three digits of your student code (for example: if a student code is 17071365 then x = 3, y = 6, z = 5 and $42xyz=$42365). a/ Use the trial-and-error method or another appropriate method to determine the internal rate of return IRRof the project (express IRR in percentage, rounded to one decimal place); b/ Find the net present value NPV of the project if the market rate r is equal to the value of IRR as found above, then give a comment.Due to the high incidence of crime, a company is giving its employees new and secured access to the company. Instead of leaving the doors open, they are installing a card system. To open the door, employees must insert a card into a slot. If a green light comes on, it is okay to turn the handle and open the door; if a yellow light comes on it indicates the door is locked from inside and you cannot enter. Suppose that 90% of the time when the card is inserted, the door should open because it is not locked from the inside. When the door should open, the system makes errors 2% of the time. That is, the green light will appear 98% of the time. When the door should not open, the system makes errors 5% of the time (green light appears). Suppose you inserted the card, and the light is green, what is the probability the door will open?If the alleles A and B of the cystic fibrosis gene occur in a population with frequencies p and 1 - p (where pis between 0 and 1), then the frequency of heterozygous carriers (carriers with both alleles) is 2p(l - p). Which value of p gives the largest frequency of heterozygous carriers?
- jessie Lim is definitely considering buying a private apartment near her parents’ house. She is interested in a 3-room unit priced at $1.8 million now. However, the current turbulence in global economy due to the outbreak of COVID-19 makes her hesitate on whether to buy it now or one year later. Singapore property market currently is still having an upward momentum despite the current situation. There is p% chance that such momentum will continue, where p is a value between 0 and 100, and the property price will increase by 15% one year later, but there is also (100-p)% chance that the market will turn negative and drop by 20% one year later. (In the following questions, we assume the money is all considered at its present value. No other factors such as loss of opportunity are taken into consideration.) How many options are available to Jessie in this decision problem?part C D 33000331 UPH-1 St. Lawrence dolomite 618 0.05 2.69 2.74 2.83 48000168 Langer Platteville dolomite 127.8 0.06 2.69 2.75 2.86 52000415 3-21-13z1 Galena dolomite 575 0.04 2.72 2.76 2.83 52000415 3-21-13z1 Platteville dolomite 740 0.05 2.7 2.75 2.85 60000086 VD #1 Silurian dolomite 684 0.03 2.75 2.78 2.83 60000086 VD #1 Galena dolomite 1070 0.05 2.69 2.74 2.84 60000086 VD #1 Platteville dolomite 1142 0.02 2.77 2.79 2.83 13001466 NS-2 Tunnel City sandstone 60.1 0.14 2.41 2.54 2.79 13001466 NS-2 Tunnel City sandstone 60.2 0.28 1.93 2.21 2.67 13001466 NS-2 Tunnel City sandstone 118.3 0.3 1.88 2.18 2.7 33000331 UPH-1 St. Peter sandstone 222 0.22 2.06 2.28 2.65 33000331 UPH-1 Jordan sandstone 531 0.21 2.09 2.3 2.65 33000331 UPH-1 Tunnel City sandstone 644 0.18 2.22 2.4 2.7 33000331 UPH-1 Wonewoc sandstone 735 0.2 2.12 2.32 2.65 33000331 UPH-1 Wonewoc sandstone 840 0.27 1.93 2.2 2.66 33000331 UPH-1 Mt. Simon sandstone 927 0.18 2.31 2.49 2.81…The 2019-2020 flu season was especially tough. By the end of the season, an estimated total of 49 million people in the United States had contracted the flu, of whom an estimated 79,000 died from the flu. Assume that the US population was 300,000,000 during the 2019-2020 flu season and that during the season, a total of 2.9 million Americans died from all causes (including the flu). Assume the population of the US remained the same at the midpoint of the season. Report mortality rates per 100,000. Be sure to express the measure in the correct format. a.What was the proportionate mortality rate from flu during the 2019-2020 flu season? b.What was the case fatality rate from flue during the 2019-2020 flu season?