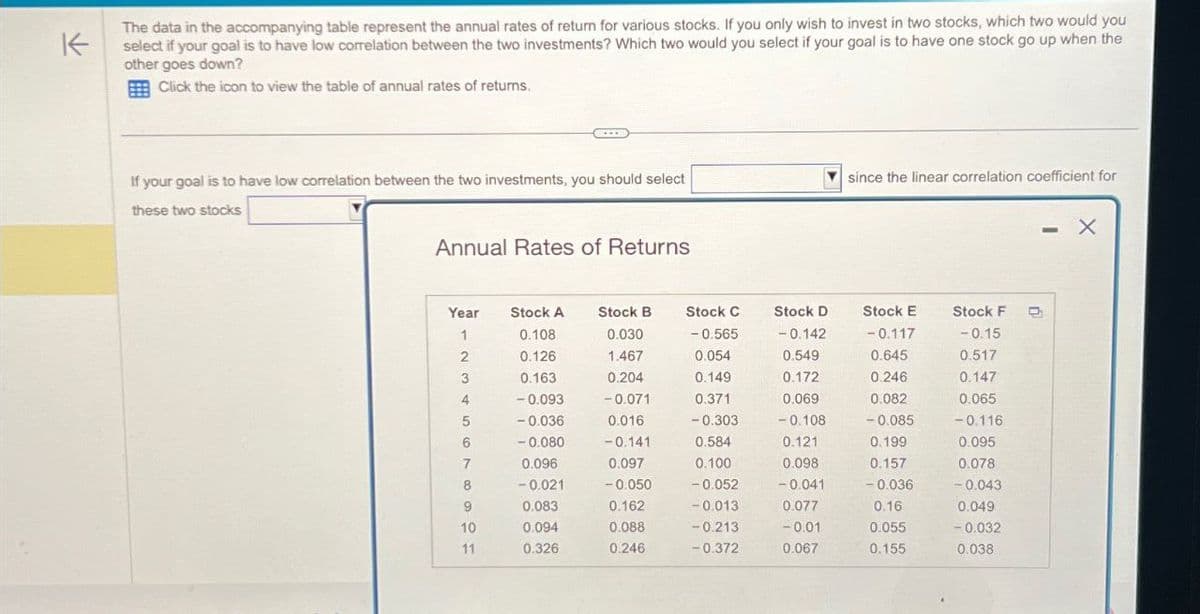
K The data in the accompanying table represent the annual rates of return for various stocks. If you only wish to invest in two stocks, which two would you select if your goal is to have low correlation between the two investments? Which two would you select if your goal is to have one stock go up when the other goes down? Click the icon to view the table of annual rates of returns. If your goal is to have low correlation between the two investments, you should select these two stocks since the linear correlation coefficient for Annual Rates of Returns Year Stock A Stock B Stock C Stock D 1 0.108 0.030 -0.565 -0.142 Stock E -0.117 Stock F -0.15 D 2 0.126 1.467 0.054 0.549 0.645 0.517 3 0.163 0.204 0.149 0.172 0.246 0.147 4 -0.093 -0.071 0.371 0.069 0.082 0.065 5 -0.036 0.016 -0.303 -0.108 -0.085 -0.116 6 -0.080 -0.141 0.584 0.121 0.199 0.095 7 0.096 0.097 0.100 0.098 0.157 0.078 8 -0.021 -0.050 -0.052 -0.041 -0.036 -0.043 9 0.083 0.162 -0.013 0.077 0.16 0.049 10 11 11 0.094 0.088 -0.213 -0.01 0.055 -0.032 0.326 0.246 -0.372 0.067 0.155 0.038 -
K The data in the accompanying table represent the annual rates of return for various stocks. If you only wish to invest in two stocks, which two would you select if your goal is to have low correlation between the two investments? Which two would you select if your goal is to have one stock go up when the other goes down? Click the icon to view the table of annual rates of returns. If your goal is to have low correlation between the two investments, you should select these two stocks since the linear correlation coefficient for Annual Rates of Returns Year Stock A Stock B Stock C Stock D 1 0.108 0.030 -0.565 -0.142 Stock E -0.117 Stock F -0.15 D 2 0.126 1.467 0.054 0.549 0.645 0.517 3 0.163 0.204 0.149 0.172 0.246 0.147 4 -0.093 -0.071 0.371 0.069 0.082 0.065 5 -0.036 0.016 -0.303 -0.108 -0.085 -0.116 6 -0.080 -0.141 0.584 0.121 0.199 0.095 7 0.096 0.097 0.100 0.098 0.157 0.078 8 -0.021 -0.050 -0.052 -0.041 -0.036 -0.043 9 0.083 0.162 -0.013 0.077 0.16 0.049 10 11 11 0.094 0.088 -0.213 -0.01 0.055 -0.032 0.326 0.246 -0.372 0.067 0.155 0.038 -
Glencoe Algebra 1, Student Edition, 9780079039897, 0079039898, 2018
18th Edition
ISBN:9780079039897
Author:Carter
Publisher:Carter
Chapter4: Equations Of Linear Functions
Section: Chapter Questions
Problem 10PFA
Related questions
Question

Transcribed Image Text:K
The data in the accompanying table represent the annual rates of return for various stocks. If you only wish to invest in two stocks, which two would you
select if your goal is to have low correlation between the two investments? Which two would you select if your goal is to have one stock go up when the
other goes down?
Click the icon to view the table of annual rates of returns.
If your goal is to have low correlation between the two investments, you should select
these two stocks
since the linear correlation coefficient for
Annual Rates of Returns
Year
Stock A
Stock B
Stock C
Stock D
1
0.108
0.030
-0.565
-0.142
Stock E
-0.117
Stock F
-0.15
D
2
0.126
1.467
0.054
0.549
0.645
0.517
3
0.163
0.204
0.149
0.172
0.246
0.147
4
-0.093
-0.071
0.371
0.069
0.082
0.065
5
-0.036
0.016
-0.303
-0.108
-0.085
-0.116
6
-0.080
-0.141
0.584
0.121
0.199
0.095
7
0.096
0.097
0.100
0.098
0.157
0.078
8
-0.021
-0.050
-0.052
-0.041
-0.036
-0.043
9
0.083
0.162
-0.013
0.077
0.16
0.049
10
11
11
0.094
0.088
-0.213
-0.01
0.055
-0.032
0.326
0.246
-0.372
0.067
0.155
0.038
-
Expert Solution
This question has been solved!
Explore an expertly crafted, step-by-step solution for a thorough understanding of key concepts.
Step by step
Solved in 2 steps

Recommended textbooks for you

Glencoe Algebra 1, Student Edition, 9780079039897…
Algebra
ISBN:
9780079039897
Author:
Carter
Publisher:
McGraw Hill

Big Ideas Math A Bridge To Success Algebra 1: Stu…
Algebra
ISBN:
9781680331141
Author:
HOUGHTON MIFFLIN HARCOURT
Publisher:
Houghton Mifflin Harcourt

Glencoe Algebra 1, Student Edition, 9780079039897…
Algebra
ISBN:
9780079039897
Author:
Carter
Publisher:
McGraw Hill

Big Ideas Math A Bridge To Success Algebra 1: Stu…
Algebra
ISBN:
9781680331141
Author:
HOUGHTON MIFFLIN HARCOURT
Publisher:
Houghton Mifflin Harcourt