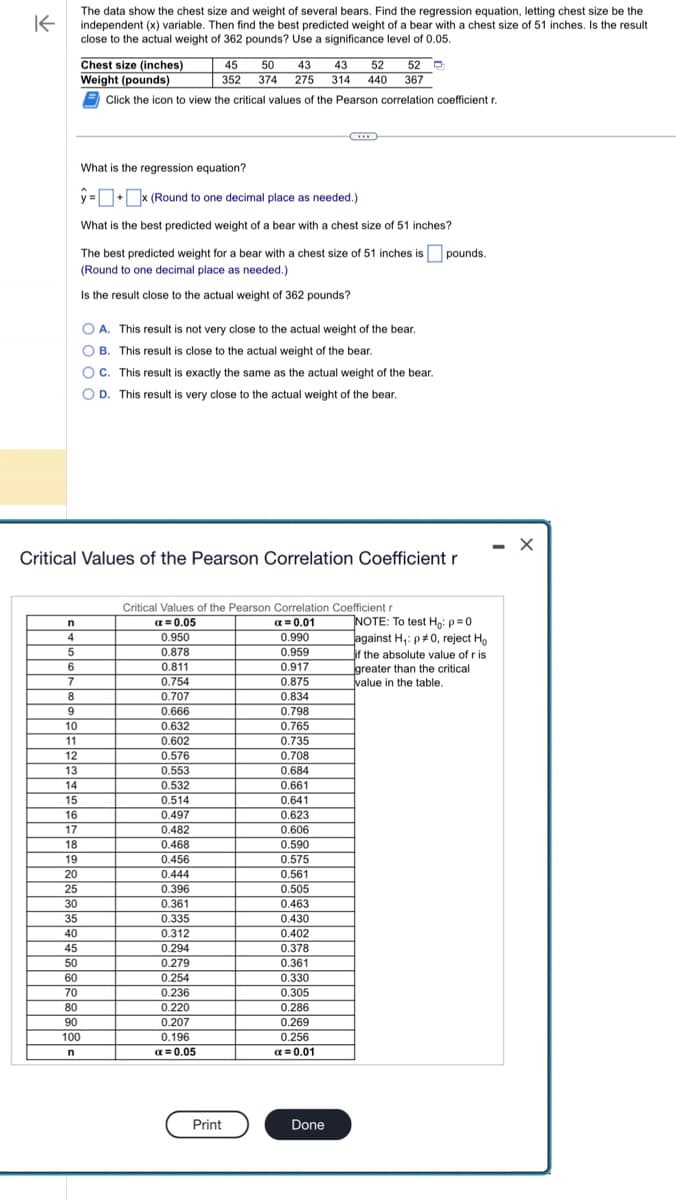
The data show the chest size and weight of several bears. Find the regression equation, letting chest size be the independent (x) variable. Then find the best predicted weight of a bear with a chest size of 51 inches. Is the result close to the actual weight of 362 pounds? Use a significance level of 0.05. Chest size (inches) Weight (pounds) Click the icon to view the critical values of the Pearson correlation coefficient r. 45 50 43 43 52 52 352 374 275 314 440 367 What is the regression equation? ŷ=+x (Round to one decimal place as needed.) What is the best predicted weight of a bear with a chest size of 51 inches? The best predicted weight for a bear with a chest size of 51 inches is pounds. (Round to one decimal place as needed.) Is the result close to the actual weight of 362 pounds? A. This result is not very close to the actual weight of the bear. B. This result is close to the actual weight of the bear. OC. This result is exactly the same as the actual weight of the bear. OD. This result is very close to the actual weight of the bear.
The data show the chest size and weight of several bears. Find the regression equation, letting chest size be the independent (x) variable. Then find the best predicted weight of a bear with a chest size of 51 inches. Is the result close to the actual weight of 362 pounds? Use a significance level of 0.05. Chest size (inches) Weight (pounds) Click the icon to view the critical values of the Pearson correlation coefficient r. 45 50 43 43 52 52 352 374 275 314 440 367 What is the regression equation? ŷ=+x (Round to one decimal place as needed.) What is the best predicted weight of a bear with a chest size of 51 inches? The best predicted weight for a bear with a chest size of 51 inches is pounds. (Round to one decimal place as needed.) Is the result close to the actual weight of 362 pounds? A. This result is not very close to the actual weight of the bear. B. This result is close to the actual weight of the bear. OC. This result is exactly the same as the actual weight of the bear. OD. This result is very close to the actual weight of the bear.

Algebra and Trigonometry (MindTap Course List)
4th Edition
ISBN:9781305071742
Author:James Stewart, Lothar Redlin, Saleem Watson
Publisher:James Stewart, Lothar Redlin, Saleem Watson
Chapter1: Equations And Graphs
Section1.FOM: Focus On Modeling: Fitting Lines To Data
Problem 10P

Related questions
Question
100%
Transcribed Image Text:K
n
4
5
6
7
The data show the chest size and weight of several bears. Find the regression equation, letting chest size be the
independent (x) variable. Then find the best predicted weight of a bear with a chest size of 51 inches. Is the result
close to the actual weight of 362 pounds? Use a significance level of 0.05.
8
9
10
11
12
13
Chest size (inches)
Weight (pounds)
Click the icon to view the critical values of the Pearson correlation coefficient r.
What is the regression equation?
ŷ=+x (Round to one decimal place as needed.)
What is the best predicted weight of a bear with a chest size of 51 inches?
The best predicted weight for a bear with a chest size of 51 inches is pounds.
(Round to one decimal place as needed.)
Is the result close to the actual weight of 362 pounds?
14
15
16
17
18
19
Critical Values of the Pearson Correlation Coefficient r
20
25
30
35
40
45
50
60
70
80
90
100
n
OA. This result is not very close to the actual weight of the bear.
OB. This result is close to the actual weight of the bear.
OC. This result is exactly the same as the actual weight of the bear.
OD. This result is very close to the actual weight of the bear.
Critical Values of the Pearson Correlation Coefficient r
α=0.05
α = 0.01
0.950
0.878
0.811
0.754
0.707
0.666
0.632
0.602
0.576
0.553
45 50 43 43 52 52 D
352 374 275 314 440 367
0.532
0.514
0.497
0.482
0.468
0.456
0.444
0.396
0.361
0.335
0.312
0.294
0.279
0.254
0.236
0.220
0.207
0.196
a=0.05
Print
0.990
0.959
0.917
0.875
0.834
0.798
0.765
0.735
0.708
0.684
0.661
0.641
0.623
0.606
0.590
0.575
0.561
0.505
0.463
0.430
0.402
0.378
0.361
0.330
0.305
0.286
0.269
0.256
α = 0.01
Done
NOTE: To test Ho: p=0
against H₁: p0, reject Ho
if the absolute value of r ist
greater than the critical
value in the table.
- X
Expert Solution
This question has been solved!
Explore an expertly crafted, step-by-step solution for a thorough understanding of key concepts.

Step by step
Solved in 3 steps with 2 images

Recommended textbooks for you
Algebra and Trigonometry (MindTap Course List)
Algebra
ISBN:
9781305071742
Author:
James Stewart, Lothar Redlin, Saleem Watson
Publisher:
Cengage Learning

Glencoe Algebra 1, Student Edition, 9780079039897…
Algebra
ISBN:
9780079039897
Author:
Carter
Publisher:
McGraw Hill

Big Ideas Math A Bridge To Success Algebra 1: Stu…
Algebra
ISBN:
9781680331141
Author:
HOUGHTON MIFFLIN HARCOURT
Publisher:
Houghton Mifflin Harcourt
Algebra and Trigonometry (MindTap Course List)
Algebra
ISBN:
9781305071742
Author:
James Stewart, Lothar Redlin, Saleem Watson
Publisher:
Cengage Learning
Glencoe Algebra 1, Student Edition, 9780079039897…
Algebra
ISBN:
9780079039897
Author:
Carter
Publisher:
McGraw Hill
Big Ideas Math A Bridge To Success Algebra 1: Stu…
Algebra
ISBN:
9781680331141
Author:
HOUGHTON MIFFLIN HARCOURT
Publisher:
Houghton Mifflin Harcourt