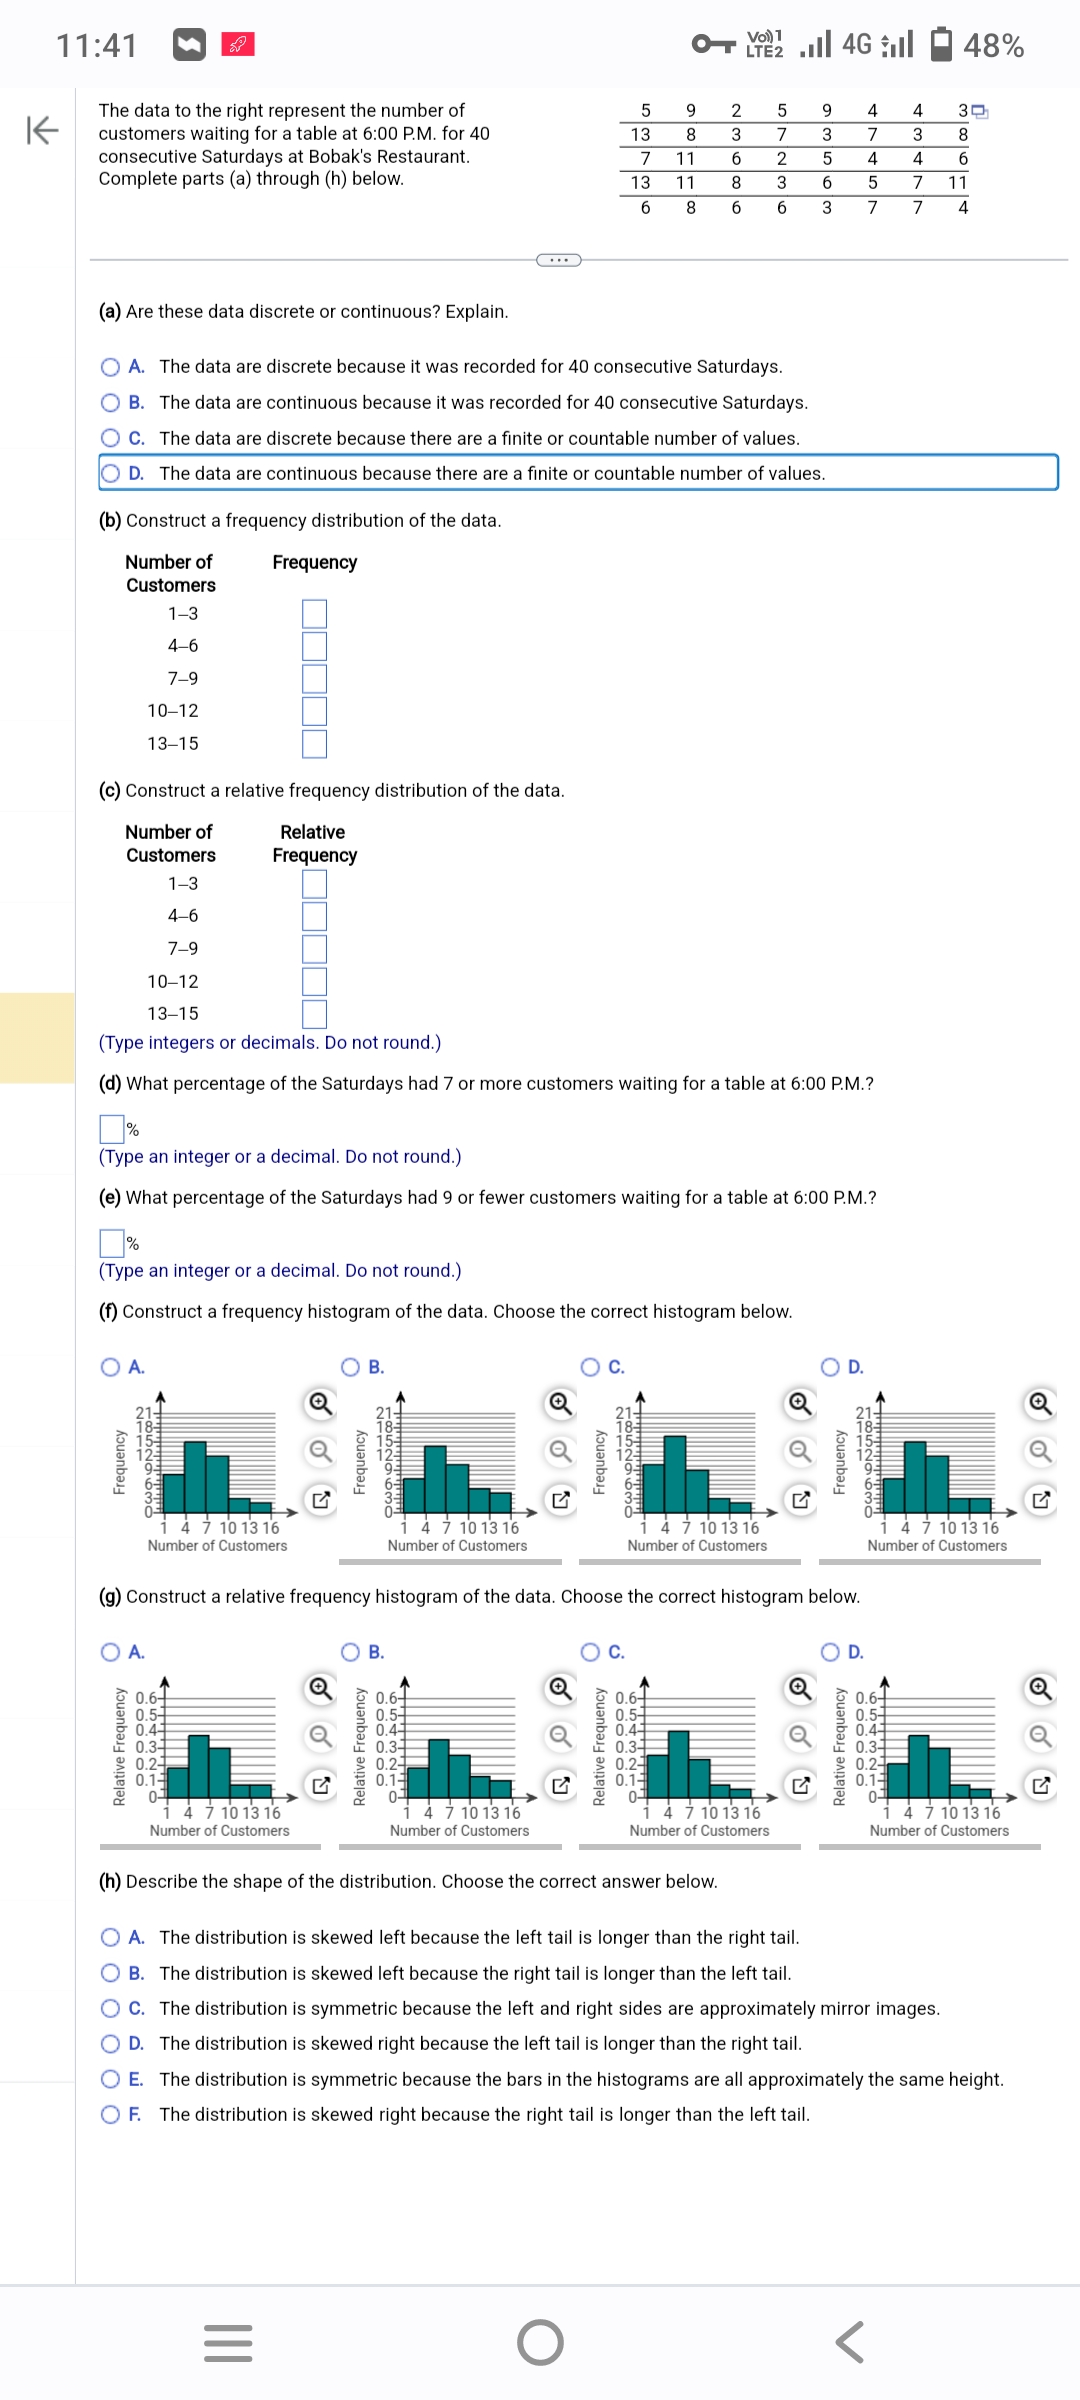
K The data to the right represent the number of customers waiting for a table at 6:00 P.M. for 40 consecutive Saturdays at Bobak's Restaurant. Complete parts (a) through (h) below. (b) Construct a frequency distribution of the data. Number of Customers 1-3 4-6 7-9 10-12 13-15 (c) Construct a relative frequency distribution of the data. Number of Relative Frequency Customers 1-3 4-6 7-9 (a) Are these data discrete or continuous? Explain. O A. The data are discrete because it was recorded for 40 consecutive Saturdays. OB. The data are continuous because it was recorded for 40 consecutive Saturdays. OC. The data are discrete because there are a finite or countable number of values. OD. The data are continuous because there are a finite or countable number of values. Frequency Frequency A. Relative Frequency 1852963O 10-12 13-15 (Type integers or decimals. Do not round.) (d) What percentage of the Saturdays had 7 or more customers waiting for a table at 6:00 P.M.? (Type an integer or a decimal. Do not round.) (f) Construct a frequency histogram of the data. Choose the correct histogram below. % (Type an integer or a decimal. Do not round.) (e) What percentage of the Saturdays had 9 or fewer customers waiting for a table at 6:00 P.M.? 1 4 7 10 13 16 Number of Customers 0.6+ 0.5- 0.4 0.3- 0.24 0.1- 0- 14 7 10 13 16 Number of Customers B. G Frequency T852963 B. Relative Frequency 0.6- 0.54 0.4 0.3- 0.2 0.1- Frequency 1 4 7 10 13 16 Number of Customers (g) Construct a relative frequency histogram of the data. Choose the correct histogram below. O A. 14 7 10 13 16 Number of Customers 5 13 7 13 6 O 1852963O C. Relative Frequency 9 8 11 6 11 8 8 6 2 3 oooooo 65432TO 4 7 10 13 16 Number of Customers Hilllll 5 7 2 3 6 L 9 3 5 6 3 4 7 10 13 16 Number of Customers (h) Describe the shape of the distribution. Choose the correct answer below. Frequency 4 7 4 5 7 D. Relative Frequency TRENDEMO 65432TO 4 3 4 7 10 13 16 Number of Customers 0.6+ SOPEL 4 7 10 13 16 Number of Customers O A. The distribution is skewed left because the left tail is longer than the right tail. OB. The distribution is skewed left because the right tail is longer than the left tail. OC. The distribution is symmetric because the left and right sides are approximately mirror images. OD. The distribution is skewed right because the left tail is longer than the right tail. O E. The distribution is symmetric because the bars in the histograms are all approximately the same height. OF. The distribution is skewed right because the right tail is longer than the left tail.
K The data to the right represent the number of customers waiting for a table at 6:00 P.M. for 40 consecutive Saturdays at Bobak's Restaurant. Complete parts (a) through (h) below. (b) Construct a frequency distribution of the data. Number of Customers 1-3 4-6 7-9 10-12 13-15 (c) Construct a relative frequency distribution of the data. Number of Relative Frequency Customers 1-3 4-6 7-9 (a) Are these data discrete or continuous? Explain. O A. The data are discrete because it was recorded for 40 consecutive Saturdays. OB. The data are continuous because it was recorded for 40 consecutive Saturdays. OC. The data are discrete because there are a finite or countable number of values. OD. The data are continuous because there are a finite or countable number of values. Frequency Frequency A. Relative Frequency 1852963O 10-12 13-15 (Type integers or decimals. Do not round.) (d) What percentage of the Saturdays had 7 or more customers waiting for a table at 6:00 P.M.? (Type an integer or a decimal. Do not round.) (f) Construct a frequency histogram of the data. Choose the correct histogram below. % (Type an integer or a decimal. Do not round.) (e) What percentage of the Saturdays had 9 or fewer customers waiting for a table at 6:00 P.M.? 1 4 7 10 13 16 Number of Customers 0.6+ 0.5- 0.4 0.3- 0.24 0.1- 0- 14 7 10 13 16 Number of Customers B. G Frequency T852963 B. Relative Frequency 0.6- 0.54 0.4 0.3- 0.2 0.1- Frequency 1 4 7 10 13 16 Number of Customers (g) Construct a relative frequency histogram of the data. Choose the correct histogram below. O A. 14 7 10 13 16 Number of Customers 5 13 7 13 6 O 1852963O C. Relative Frequency 9 8 11 6 11 8 8 6 2 3 oooooo 65432TO 4 7 10 13 16 Number of Customers Hilllll 5 7 2 3 6 L 9 3 5 6 3 4 7 10 13 16 Number of Customers (h) Describe the shape of the distribution. Choose the correct answer below. Frequency 4 7 4 5 7 D. Relative Frequency TRENDEMO 65432TO 4 3 4 7 10 13 16 Number of Customers 0.6+ SOPEL 4 7 10 13 16 Number of Customers O A. The distribution is skewed left because the left tail is longer than the right tail. OB. The distribution is skewed left because the right tail is longer than the left tail. OC. The distribution is symmetric because the left and right sides are approximately mirror images. OD. The distribution is skewed right because the left tail is longer than the right tail. O E. The distribution is symmetric because the bars in the histograms are all approximately the same height. OF. The distribution is skewed right because the right tail is longer than the left tail.

Holt Mcdougal Larson Pre-algebra: Student Edition 2012
1st Edition
ISBN:9780547587776
Author:HOLT MCDOUGAL
Publisher:HOLT MCDOUGAL
Chapter11: Data Analysis And Probability
Section11.1: Stem-and-leaf Plots And Histograms
Problem 5E

Related questions
Question
Transcribed Image Text:K
11:41
The data to the right represent the number of
customers waiting for a table at 6:00 P.M. for 40
consecutive Saturdays at Bobak's Restaurant.
Complete parts (a) through (h) below.
(b) Construct a frequency distribution of the data.
Number of
Customers
1-3
4-6
7-9
10-12
13-15
(c) Construct a relative frequency distribution of the data.
Number of
Relative
Frequency
Customers
1-3
4-6
7-9
(a) Are these data discrete or continuous? Explain.
O A. The data are discrete because it was recorded for 40 consecutive Saturdays.
OB. The data are continuous because it was recorded for 40 consecutive Saturdays.
OC. The data are discrete because there are a finite or countable number of values.
O D. The data are continuous because there are a finite or countable number of values.
O A.
Frequency
2111
-லமNகமிறம்
Frequency
10-12
13-15
(Type integers or decimals. Do not round.)
(d) What percentage of the Saturdays had 7 or more customers waiting for a table at 6:00 P.M.?
A.
Relative Frequency
(Type an integer or a decimal. Do not round.)
(e) What percentage of the Saturdays had 9 or fewer customers waiting for a table at 6:00 P.M.?
(Type an integer or a decimal. Do not round.)
(f) Construct a frequency histogram of the data. Choose the correct histogram below.
4 7 10 13 16
Number of Customers
☐☐☐☐
0.6+
0.5-
0.41
0.3-
0.2-1
0.1-
01
4 7 10 13 16
Number of Customers
Frequency
|||
=
B.
Relative Frequency
1852963
4 7 10 13 16
Number of Customers
B.
(g) Construct a relative frequency histogram of the data. Choose the correct histogram below.
0.6+
0.5-
0.41
0.3-
0.24
0.1
01
5
13
7
11
13
11 8
6 8 6
4 7 10 13 16
Number of Customers.
Frequency
Relative Frequency
பழமய மறம்
O
9
8
<!!!!!!!
LTE2
2
5
3
7
6 2
3
6
4 7 10 13 16
Number of Customers
P7NWAGO
0.54
0.3-
0.2-
0.1-
0-
(h) Describe the shape of the distribution. Choose the correct answer below.
9 4
3
7
5
4
6
5
3
7
7 10 13 16
Number of Customers
Frequency
Relative Frequency
185296MO
D.
4
3
4
7
7
0.6-
0.5-
0.44
0.3-
0.2
0.1
0-
O A. The distribution is skewed left because the left tail is longer than the right tail.
OB. The distribution is skewed left because the right tail is longer than the left tail.
C. The distribution is symmetric because the left and right sides are approximately mirror images.
OD. The distribution is skewed right because the left tail is longer than the right tail.
48%
7 10 13 16
Number of Customers.
30
8
6
11
4
O E. The distribution is symmetric because the bars in the histograms are all approximately the same height.
OF. The distribution is skewed right because the right tail is longer than the left tail.
4 7 10 13 16
Number of Customers
Expert Solution
This question has been solved!
Explore an expertly crafted, step-by-step solution for a thorough understanding of key concepts.

This is a popular solution!

Trending now
This is a popular solution!

Step by step
Solved in 2 steps with 2 images

Recommended textbooks for you
Holt Mcdougal Larson Pre-algebra: Student Edition…
Algebra
ISBN:
9780547587776
Author:
HOLT MCDOUGAL
Publisher:
HOLT MCDOUGAL

Big Ideas Math A Bridge To Success Algebra 1: Stu…
Algebra
ISBN:
9781680331141
Author:
HOUGHTON MIFFLIN HARCOURT
Publisher:
Houghton Mifflin Harcourt

Glencoe Algebra 1, Student Edition, 9780079039897…
Algebra
ISBN:
9780079039897
Author:
Carter
Publisher:
McGraw Hill
Holt Mcdougal Larson Pre-algebra: Student Edition…
Algebra
ISBN:
9780547587776
Author:
HOLT MCDOUGAL
Publisher:
HOLT MCDOUGAL
Big Ideas Math A Bridge To Success Algebra 1: Stu…
Algebra
ISBN:
9781680331141
Author:
HOUGHTON MIFFLIN HARCOURT
Publisher:
Houghton Mifflin Harcourt
Glencoe Algebra 1, Student Edition, 9780079039897…
Algebra
ISBN:
9780079039897
Author:
Carter
Publisher:
McGraw Hill