Rey figures för Apple and Google follow. S millions Cash and equivalents Accounts receivable, net Inventories Retained carnings Cost of sales Revenues Total assets Apple $ 48,844 22,926 4,106 45,898 161,782 260, 174 338,516 Google $ 18,498 25,326 999 152,122 71,896 161,857 275,909 Required: 1. Compute common-size percents for each company using the data given. 2. If Google paid a dividend, would retained earnings as a percent of total assets increase or decrease? 3. Which company has the better gross margin ratio on sales?
Rey figures för Apple and Google follow. S millions Cash and equivalents Accounts receivable, net Inventories Retained carnings Cost of sales Revenues Total assets Apple $ 48,844 22,926 4,106 45,898 161,782 260, 174 338,516 Google $ 18,498 25,326 999 152,122 71,896 161,857 275,909 Required: 1. Compute common-size percents for each company using the data given. 2. If Google paid a dividend, would retained earnings as a percent of total assets increase or decrease? 3. Which company has the better gross margin ratio on sales?

Accounting (Text Only)
26th Edition
ISBN:9781285743615
Author:Carl Warren, James M. Reeve, Jonathan Duchac
Publisher:Carl Warren, James M. Reeve, Jonathan Duchac
Chapter17: Financial Statement Analysis
Section: Chapter Questions
Problem 17.3CP: Vertical analysis The condensed income statements through income from operations for Dell Inc. and...

Related questions

Question
Please help me
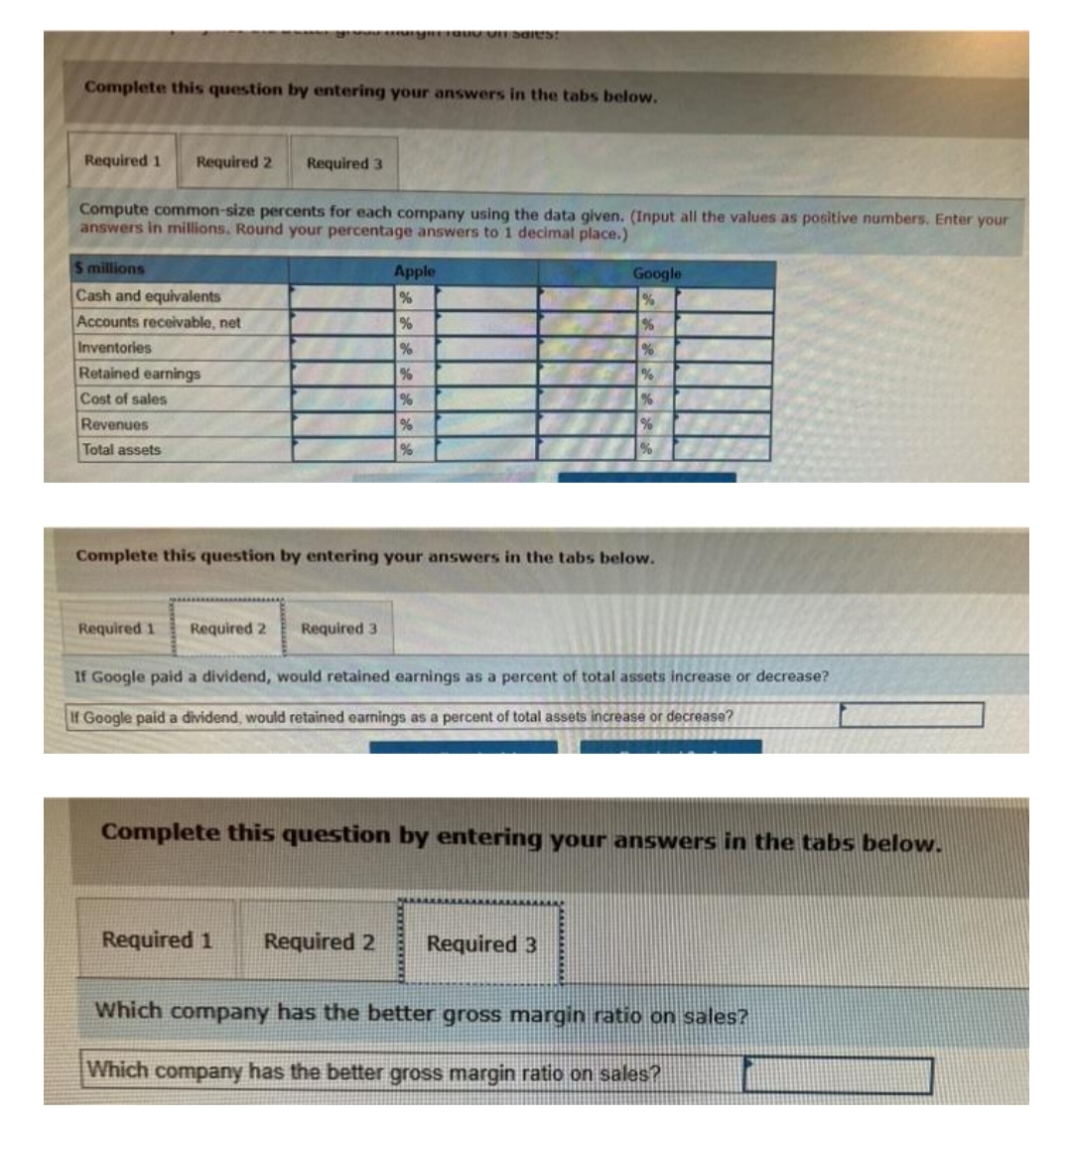
Transcribed Image Text:Complete this question by entering your answers in the tabs below.
Required 1
Required 2
Required 3
Compute common-size percents for each company using the data given. (Input all the values as positive numbers. Enter your
answers in millions. Round your percentage answers to 1 decimal place.)
S millions
Apple
%
Google
Cash and equivalents
Accounts receivable, net
Inventories
Retained earnings
%
%
Cost of sales
Revenues
%
Total assets
Complete this question by entering your answers in the tabs below.
Required 1
Required 2
Required 3
If Google paid a dividend, would retained earnings as a percent of total assets increase or decrease?
If Google paid a dividend, would retained earnings as a percent of total assets increase or decrease?
Complete this question by entering your answers in the tabs below.
Required 1
Required 2
Required 3
Which company has the better gross margin ratio on sales?
Which company has the better gross margin ratio on sales?
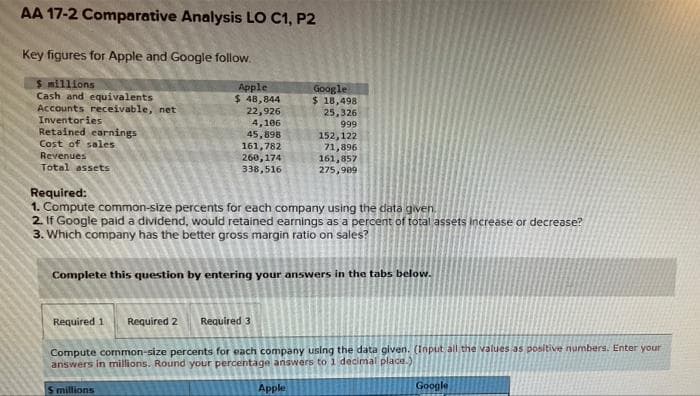
Transcribed Image Text:AA 17-2 Comparative Analysis LO C1, P2
Key figures for Apple and Google follow.
$ millions
Cash and equivalents
Accounts receivable, net
Inventories
Retained carnings
Cost of sales
Apple
$ 48,844
22,926
4,106
45,898
161,782
260,174
338,516
Google
$ 18,498
25,326
999
152,122
71,896
161,857
275,909
Revenues
Total assets
Required:
1. Compute common-size percents for each company using the data given.
2. If Google paid a dividend, would retained earnings as a percent of total assets increase or decrease?
3. Which company has the better gross margin ratio on sales?
Complete this question by entering your answers in the tabs below.
Required 1
Required 2
Required 3
Compute cormmon-size percents for each company using the data given. (Input all the values as positive numbers. Enter your
answers in millions. Round your percentage answers to 1 decimal place.)
S millions
Apple
Google
Expert Solution
This question has been solved!
Explore an expertly crafted, step-by-step solution for a thorough understanding of key concepts.

This is a popular solution!

Trending now
This is a popular solution!

Step by step
Solved in 2 steps

Knowledge Booster


Learn more about
Need a deep-dive on the concept behind this application? Look no further. Learn more about this topic, accounting and related others by exploring similar questions and additional content below.Recommended textbooks for you
Accounting (Text Only)
Accounting
ISBN:
9781285743615
Author:
Carl Warren, James M. Reeve, Jonathan Duchac
Publisher:
Cengage Learning

Corporate Financial Accounting
Accounting
ISBN:
9781337398169
Author:
Carl Warren, Jeff Jones
Publisher:
Cengage Learning

Financial & Managerial Accounting
Accounting
ISBN:
9781285866307
Author:
Carl Warren, James M. Reeve, Jonathan Duchac
Publisher:
Cengage Learning
Accounting (Text Only)
Accounting
ISBN:
9781285743615
Author:
Carl Warren, James M. Reeve, Jonathan Duchac
Publisher:
Cengage Learning
Corporate Financial Accounting
Accounting
ISBN:
9781337398169
Author:
Carl Warren, Jeff Jones
Publisher:
Cengage Learning
Financial & Managerial Accounting
Accounting
ISBN:
9781285866307
Author:
Carl Warren, James M. Reeve, Jonathan Duchac
Publisher:
Cengage Learning
