Key Social and Economic Data Unemployment (% in 2014) Life Expectancy Annual Growth Country (% change in real GDP) 2014 2014 Male Female China 73.4 77.7 7.3 4.1 Poland 73.5 81.5 3.4 12.3 0.6 5.2 Russia 64.7 76.6 Slovenia 74.4 81.9 3.0 13.1
Key Social and Economic Data Unemployment (% in 2014) Life Expectancy Annual Growth Country (% change in real GDP) 2014 2014 Male Female China 73.4 77.7 7.3 4.1 Poland 73.5 81.5 3.4 12.3 0.6 5.2 Russia 64.7 76.6 Slovenia 74.4 81.9 3.0 13.1

Economics Today and Tomorrow, Student Edition
1st Edition
ISBN:9780078747663
Author:McGraw-Hill
Publisher:McGraw-Hill
Chapter19: Economic Growth In Developing Nations
Section: Chapter Questions
Problem 17AA

Related questions
Question
Using the table, comment on wether the Polish economy performed better in 2014 than the Russian economy.
Transcribed Image Text:together and turn it in.
Since 1989 Eastern European countries have moved from operating planned economies towards operating market
economies, This rate of change has varied. Russia and Kazakhstan, for instance, sold off its state owned enterprises
(SOES) and generally reduced government intervention at a quick rate. In contrast, Croatia, Poland and Slovenia
removed price controls and subsidies and privatized relatively slowly.
Some economists claim that the "shock therapy" swept away safety nets with state ownership. In a number of
Russian towns, the SOES provided not only jobs but also healthcare, childcare and pensions, When the SOES were sold
off unemployment rose and life expectancy fell. The lives of men were particularly badly affected with their lifespan
falling even further than that of women.
The question of how fast to make the transition from a planned to a market economy is now facing China. The
country is becoming more market orientated with the role of the private sector increasing. Structural change is also
occurring with the proportion of output and employment accounted for by the secondary and tertiary sectors increasing.
The first decade of the twenty-first century witnessed a period of rapid economic growth in China boosted by high
levels of investment and a low exchange rate which increased net exports. Although the country's economic growth
slowed in the second decade of the twenty-first century it was still higher than most countries.
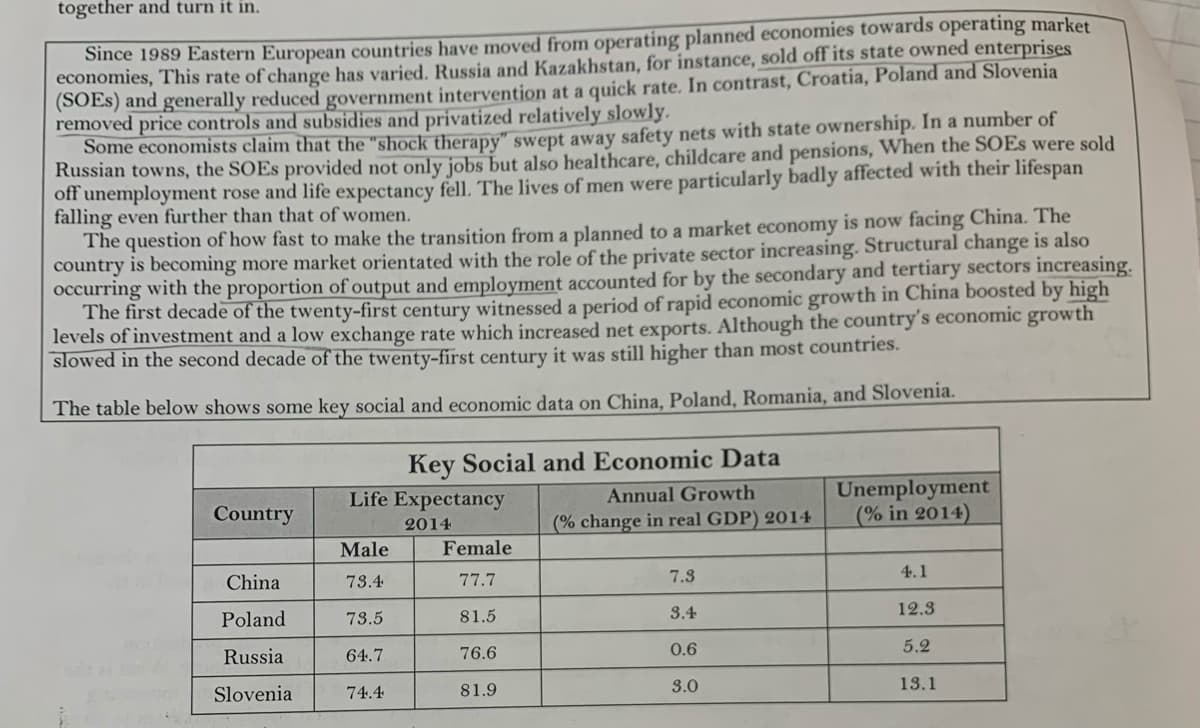
The table below shows some key social and economic data on China, Poland, Romania, and Slovenia.
Key Social and Economic Data
Unemployment
(% in 2014)
Life Expectancy
Annual Growth
Country
2014
(% change in real GDP) 2014
Male
Female
7.3
4.1
China
73.4
77.7
Poland
73.5
81.5
3.4
12.3
Russia
64.7
76.6
0.6
5.2
Slovenia
74.4
81.9
3.0
13.1
Expert Solution
This question has been solved!
Explore an expertly crafted, step-by-step solution for a thorough understanding of key concepts.

Step by step
Solved in 2 steps

Knowledge Booster


Learn more about
Need a deep-dive on the concept behind this application? Look no further. Learn more about this topic, economics and related others by exploring similar questions and additional content below.Recommended textbooks for you
Economics Today and Tomorrow, Student Edition
Economics
ISBN:
9780078747663
Author:
McGraw-Hill
Publisher:
Glencoe/McGraw-Hill School Pub Co
Economics Today and Tomorrow, Student Edition
Economics
ISBN:
9780078747663
Author:
McGraw-Hill
Publisher:
Glencoe/McGraw-Hill School Pub Co