Kindly Do Part A , by using the attached information. please do a flow chat. Task: The City of Johannesburg will be implementing solar-powered traffic light systems at some of its’ major intersections. To this end, you are to develop: (a) Project Part A: a hand-written or computer generated 1 page algorithm of the process undertaken in Project Part B. (b) Project Part B: One (1) Microsoft Excel Macro-Enabled file containing worksheets and VBA code that would simulate (over a peak 15 minute period of a working day) the movement of vehicles arriving at one of the City’s major intersections. Structure of VBA code Use of comments Innovative and user-friendly For ‘Worksheet (pre-timed)’:
Kindly Do Part A , by using the attached information. please do a flow chat. Task: The City of Johannesburg will be implementing solar-powered traffic light systems at some of its’ major intersections. To this end, you are to develop: (a) Project Part A: a hand-written or computer generated 1 page algorithm of the process undertaken in Project Part B. (b) Project Part B: One (1) Microsoft Excel Macro-Enabled file containing worksheets and VBA code that would simulate (over a peak 15 minute period of a working day) the movement of vehicles arriving at one of the City’s major intersections. Structure of VBA code Use of comments Innovative and user-friendly For ‘Worksheet (pre-timed)’:
Kindly Do Part A , by using the attached information. please do a flow chat. Task: The City of Johannesburg will be implementing solar-powered traffic light systems at some of its’ major intersections. To this end, you are to develop: (a) Project Part A: a hand-written or computer generated 1 page algorithm of the process undertaken in Project Part B. (b) Project Part B: One (1) Microsoft Excel Macro-Enabled file containing worksheets and VBA code that would simulate (over a peak 15 minute period of a working day) the movement of vehicles arriving at one of the City’s major intersections. Structure of VBA code Use of comments Innovative and user-friendly For ‘Worksheet (pre-timed)’:
Kindly Do Part A , by using the attached information. please do a flow chat.
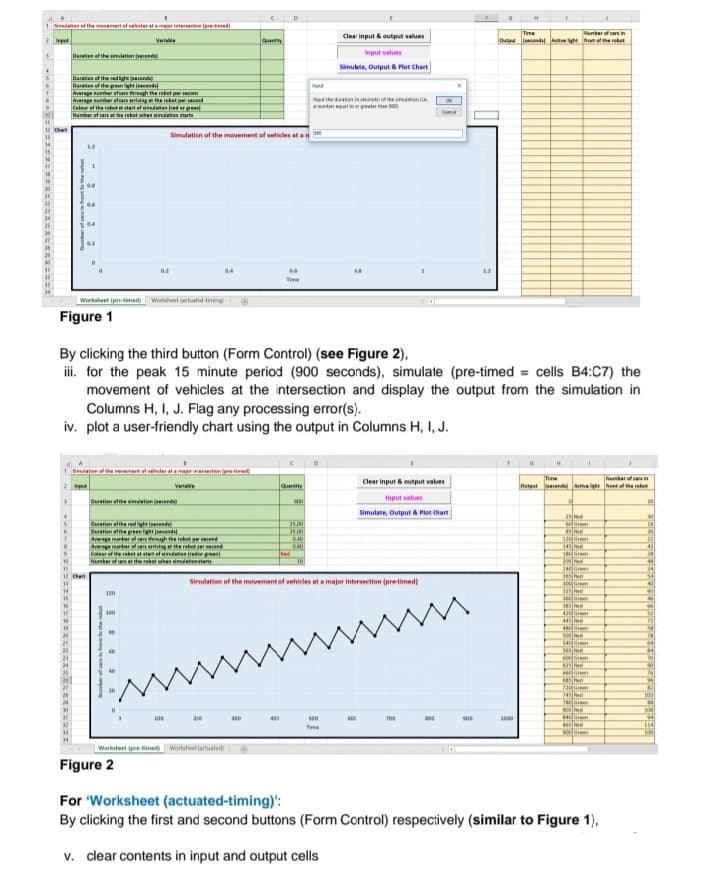
Task: The City of Johannesburg will be implementing solar-powered traffic light systems at some of its’ major intersections. To this end, you are to develop: (a) Project Part A: a hand-written or computer generated 1 page algorithm of the process undertaken in Project Part B. (b) Project Part B: One (1) Microsoft Excel Macro-Enabled file containing worksheets and VBA code that would simulate (over a peak 15 minute period of a working day) the movement of vehicles arriving at one of the City’s major intersections. Structure of VBA code Use of comments Innovative and user-friendly For ‘Worksheet (pre-timed)’: By clicking the first and second buttons (Form Control) respectively (see Figure 1), i. clear contents in input and output cells. ii. invite the user, using input boxes, to enter the required inputs that will be saved into the appropriate worksheet cells (no direct input into a worksheet cell is permitted). Flag all input error(s).
Transcribed Image Text:A
1 Smation of the movement of seveles at a major intersection (pre-med
2 Input
Duration of the simulation (second)
4
Duration of the red light (seconda)
Duration of the green light (seconds)
Average number of cars through the robot per secon
Average number of cars arriving at the robot per second
Colour of the robot at start of sivedation fred or grees)
Number of cars at the robot when simulation starts
1.2
C
Quartty
Simulation of the movement of vehicles at an
1
248
4.6
804
02
0.2
04
0.4
18
1.2
Worksheet (pr-timed) Worksheet(cuad-ting
Figure 1
By clicking the third button (Form Control) (see Figure 2),
iii. for the peak 15 minute period (900 seconds), simulate (pre-timed = cells B4:C7) the
movement of vehicles at the intersection and display the output from the simulation in
Columns H, I, J. Flag any processing error(s).
iv. plot a user-friendly chart using the output in Columns H, I, J.
H
1
1 Simulation of the revement of vehicles at a major intersection (pre-timed
T
Clear input & output values
Number of cars in
2
Quantity
Outputs) Active light front of the robot
of
3
Curation afthaimation (secondal)
Input values
000
10
Simulate, Output & Plot Chart
25 Ped
Duration of the red light (c)
25.00
60 Green
16
Curation of the green light seconds)
35.00
45 Red
34
0.40
Average mamber of cars through the robot preced
Average number of cars arriving at the robot per cond
120 Gree
145
22
60
43
Coleer of the rebet at start of sivedation (red)
Number of cars at the rebet when s
24
10
180 Gre
300 Pla
41
11
34
12 Chart
54
Simulation of the movement of vehicles at a major intersection (pre-timed)
240 Grem
265 Pied
300Green
325 Ped
360 Gree
40
320
40
385 Red
66
100
m
58
430 Green
445 ee
480 Cre
50 Red
540 Gree
565 Red
600 Grem
625 Red
60
Grem
05 Fe
220 Grem
245
Grem
805 Red
140 Gre
210
300
400
100
cox
700
000
900
1000
Tie
e
100 Gree
Worksheet (pre-timed) Worksheet jacuated
Figure 2
For 'Worksheet (actuated-timing)':
By clicking the first and second buttons (Form Control) respectively (similar to Figure 1),
v. clear contents in input and output cells
D
12 Chart
Clear input & output values
Input values
Simulate, Output & Plot Chart
ingut the duration in second of the simulatione
a number equal to or greater than 100
H
Concel
G
I
Time
Number of cars in
Outge second Active light frost of the robot
940
32
102
11
108
94
114
100
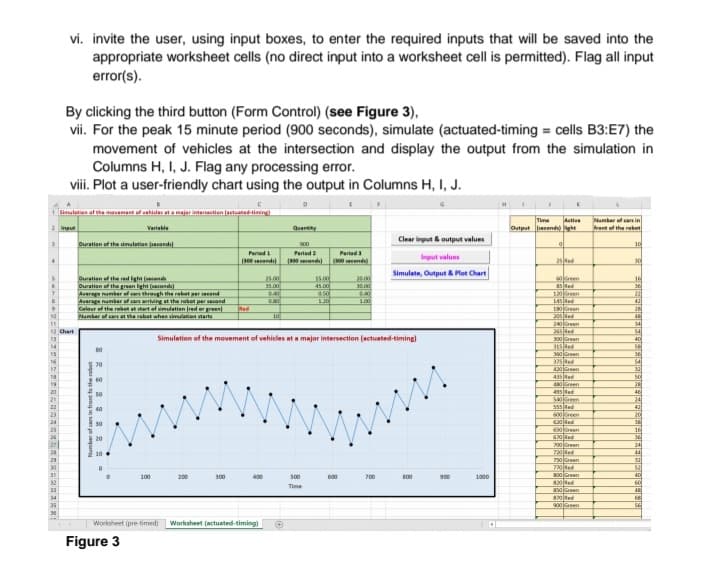
Transcribed Image Text:vi. invite the user, using input boxes, to enter the required inputs that will be saved into the
appropriate worksheet cells (no direct input into a worksheet cell is permitted). Flag all input
error(s).
By clicking the third button (Form Control) (see Figure 3),
vii. For the peak 15 minute period (900 seconds), simulate (actuated-timing = cells B3:E7) the
movement of vehicles at the intersection and display the output from the simulation in
Columns H, I, J. Flag any processing error.
viii. Plot a user-friendly chart using the output in Columns H, I, J.
Simulation of the movement of vehicles at a major intersection (actuated-timing)
Time Active
2 Ingu
Variable
Number of cars in
front of the rabot
Output seconds)
3
Duration of the simulation (second)
900
10
Clear input & output values
Input values
Period
Period 2
Pariad 3
4
(300 d (900) (800 seconds)
30
Simulate, Output & Plot Chart
5
Duration of the red light (
25.00
20.00
16
Duration of the green light (seconds)
450
30.00
36
0.40
4.50
0.40
22
0.00
1.20
1.00
Average number of cars through the rabot per second
Average number of cars arriving at the robot per second
Calour of the robot at start of simulation fred or green
Number of cars at the rebat when simulation starts
433
Red
28
10
10
46
34
12 Chart
54
Simulation of the movement of vehicles at a major intersection (actuated-timing)
40
14
56
15
3
EC
16
SA
33
50
=
ES
40
an
24
41
43
20
30
mm
16
36
24
M
44
37
32
53
N
100
200
300
400
500
800
40
Time
60
46
68
se
Worksheet (pre-timed) Worksheet (actuated-timing) O
Number of cars in front to the robot
2288922
80
70
60
40
Figure 3
600
200
900
1000
25 d
60 Green
85 Red
120 Green
145 Red
180
205 Red
240 Green
265 Red
330 Green
315 Red
350 Green
375 Red
420 Green
435 Red
480 Green
435 Red
540 Green
555 Red
600 Green
630
650 Green
620 And
700 Green
720 Bed
750 Green
770
Boken
820 Red
50 Green
870 Red
900 Green
Process or set of rules that allow for the solving of specific, well-defined computational problems through a specific series of commands. This topic is fundamental in computer science, especially with regard to artificial intelligence, databases, graphics, networking, operating systems, and security.
Expert Solution
This question has been solved!
Explore an expertly crafted, step-by-step solution for a thorough understanding of key concepts.