Kouanbay makulacturer claims that the life spans of the tires are normally distributed, with a mean of 40,000 miles and a standard deviation mplete parts (a) through (c) below. O 902" 081 asses. Choose the correct answer below. OB. Oc. Life spans of tires Life spans of tires 275555 Distance (in miles) Distance (in miles)
Kouanbay makulacturer claims that the life spans of the tires are normally distributed, with a mean of 40,000 miles and a standard deviation mplete parts (a) through (c) below. O 902" 081 asses. Choose the correct answer below. OB. Oc. Life spans of tires Life spans of tires 275555 Distance (in miles) Distance (in miles)

Glencoe Algebra 1, Student Edition, 9780079039897, 0079039898, 2018
18th Edition
ISBN:9780079039897
Author:Carter
Publisher:Carter
Chapter10: Statistics
Section10.4: Distributions Of Data
Problem 19PFA

Related questions
Question
Transcribed Image Text:(uanha
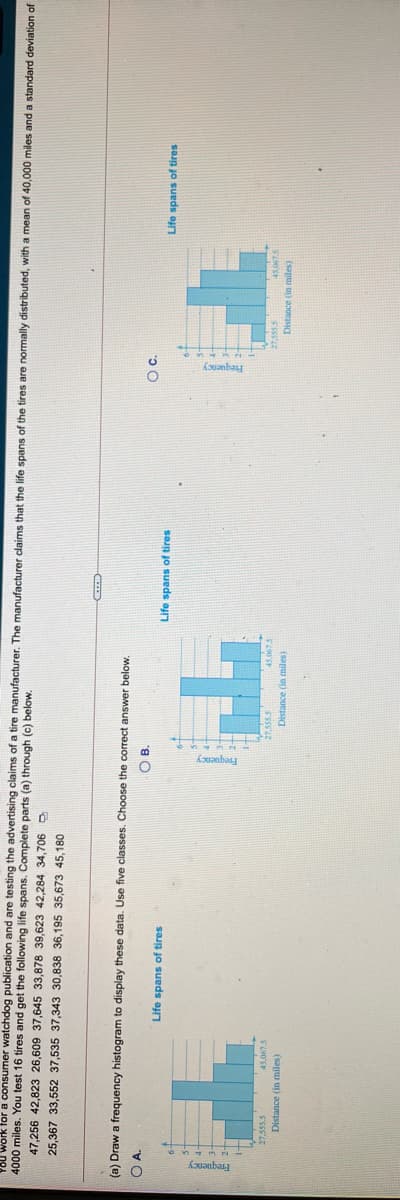
work for a consumer watchdog publication and are testing the advertising claims of a tire manufacturer. The manufacturer claims that the life spans of the tires are normally distributed, with
4000 miles. You test 16 tires and get the following life spans. Complete parts (a) through (c) below.
mean of 40,0000 miles and a standard deviation of
47,256 42,823 26,609 37,645 33,878 39,623 42,284 34,706 D
25,367 33,552 37,535 37,343 30,838 36,195 35,673 45,180
(a) Draw
frequency histogram to display these data. Use five classes. Choose the correct answer below.
O B.
Life spans of tires
Life spans of tires
Life spans of tires
27,5555
45.067.5
45,0675
Distance (in miles)
27,555.5
Distance (in miles)
(samu u) 2JUS
Expert Solution
Step 1 : Introduction
Frequency distribution table :
A statistical distribution may be a list, table, or graph in statistics that shows the frequency of various outcomes during a sample.
The frequency or count of occurrences of values among a precise cluster or interval is contained in every table entry.

Step by step
Solved in 2 steps with 1 images

Recommended textbooks for you
Glencoe Algebra 1, Student Edition, 9780079039897…
Algebra
ISBN:
9780079039897
Author:
Carter
Publisher:
McGraw Hill
Glencoe Algebra 1, Student Edition, 9780079039897…
Algebra
ISBN:
9780079039897
Author:
Carter
Publisher:
McGraw Hill