L2Q10.The following table displays the sales figures achieved by several major soft drink companies in 1992. Company Cases Sold (Million) Thumbs 8 3256.6 Pepsi Up 2356.9 Natural Beverages 1123.4 Royal Crown - 8 115.6 Others 358.8 Which of the following graphs represents the given data?
L2Q10.The following table displays the sales figures achieved by several major soft drink companies in 1992. Company Cases Sold (Million) Thumbs 8 3256.6 Pepsi Up 2356.9 Natural Beverages 1123.4 Royal Crown - 8 115.6 Others 358.8 Which of the following graphs represents the given data?

Linear Algebra: A Modern Introduction
4th Edition
ISBN:9781285463247
Author:David Poole
Publisher:David Poole
Chapter2: Systems Of Linear Equations
Section2.4: Applications
Problem 6EQ: Redo Exercise 5, assuming that the house blend contains 300 grams of Colombian beans, 50 grams of...

Related questions
Question
L2Q10.The following table displays the sales figures achieved by several major soft drink companies in 1992.
| Company | Cases Sold (Million) |
| Thumbs 8 | 3256.6 |
| Pepsi Up | 2356.9 |
| Natural Beverages | 1123.4 |
| Royal Crown - 8 | 115.6 |
| Others | 358.8 |
Which of the following graphs represents the given data?
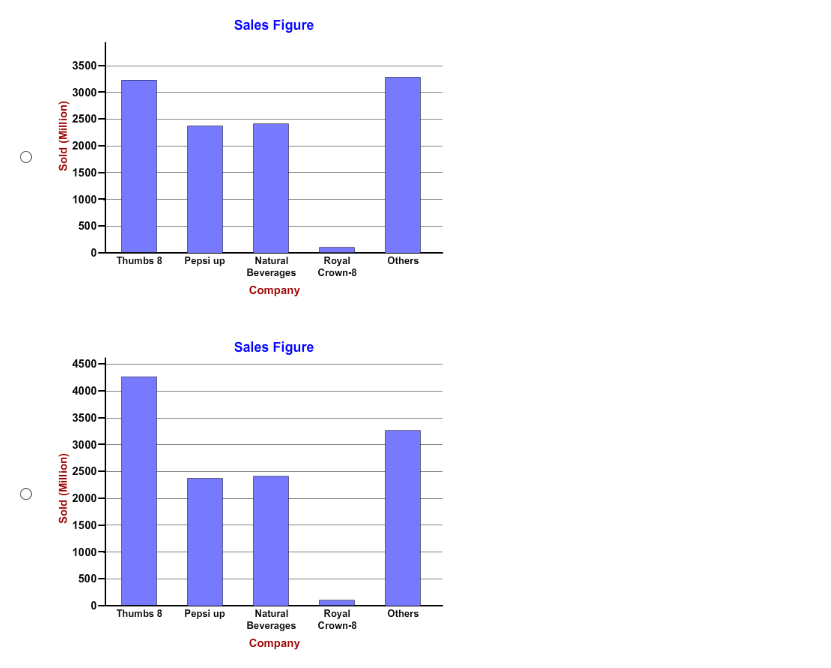
Transcribed Image Text:Sales Figure
3500-
3000-
2500-
2000-
1500
1000-
500-
0.
Thumbs 8
Pepsi up
Royal
Сrown-8
Natural
Others
Beverages
Company
Sales Figure
4500-
4000-
3500-
3000-
2500-
%3D
2000-
1500-
1000-
500-
Thumbs 8
Pepsi up
Natural
Beverages
Royal
Сrown-8
Others
Company
Sold (Million)
Sold (Million)
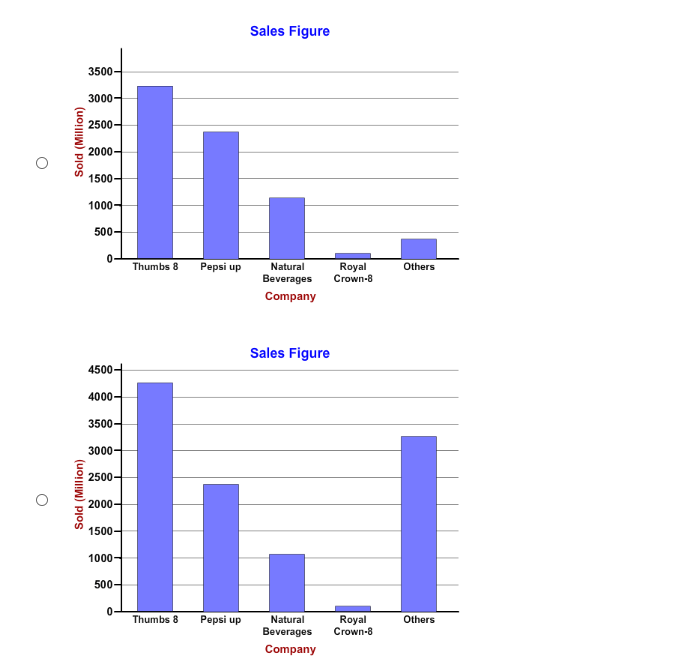
Transcribed Image Text:Sales Figure
3500-
3000
2500-
2000-
1500-
1000-
Реpsi up
Royal
Crown-8
Thumbs 8
Natural
Others
Beverages
Company
Sales Figure
4500-
4000-
3500-
3000-
2500-
2000-
1500-
1000-
500-
Thumbs 8
Pepsi up
Natural
Royal
Crown-8
Others
Beverages
Company
Sold (Million)
Sold (Million)
Expert Solution
This question has been solved!
Explore an expertly crafted, step-by-step solution for a thorough understanding of key concepts.

Step by step
Solved in 3 steps

Recommended textbooks for you
Linear Algebra: A Modern Introduction
Algebra
ISBN:
9781285463247
Author:
David Poole
Publisher:
Cengage Learning
Linear Algebra: A Modern Introduction
Algebra
ISBN:
9781285463247
Author:
David Poole
Publisher:
Cengage Learning