Lab 3 - Word Khalia Merriweather Layout References Mailings Review View Help O Tell me what you want to do For questions 4-7: ACT Math Scores are normally distributed with a mean score of 21 and a standard deviation of 5. A random sample of 25 SAT Math scores are collected. 4. Find Hz- Find og. 5. Sketch the normal curve above the axis given below. Label the axis with the correct letter and 7 values (sampling mean and the values that represent 1, 2, and 3 standard errors of the mean away from the sampling mean.) 6. Mark the value of 24 on the sketch you did in #4 and shade the section of the curve that corresponds to "above 24". 7. Find the probability that the sample mean is above 24.
Lab 3 - Word Khalia Merriweather Layout References Mailings Review View Help O Tell me what you want to do For questions 4-7: ACT Math Scores are normally distributed with a mean score of 21 and a standard deviation of 5. A random sample of 25 SAT Math scores are collected. 4. Find Hz- Find og. 5. Sketch the normal curve above the axis given below. Label the axis with the correct letter and 7 values (sampling mean and the values that represent 1, 2, and 3 standard errors of the mean away from the sampling mean.) 6. Mark the value of 24 on the sketch you did in #4 and shade the section of the curve that corresponds to "above 24". 7. Find the probability that the sample mean is above 24.

Glencoe Algebra 1, Student Edition, 9780079039897, 0079039898, 2018
18th Edition
ISBN:9780079039897
Author:Carter
Publisher:Carter
Chapter10: Statistics
Section10.3: Measures Of Spread
Problem 26PFA

Related questions

Concept explainers
Equations and Inequations
Equations and inequalities describe the relationship between two mathematical expressions.
Linear Functions
A linear function can just be a constant, or it can be the constant multiplied with the variable like x or y. If the variables are of the form, x2, x1/2 or y2 it is not linear. The exponent over the variables should always be 1.
Question
4) ?
5) ?
6) ?
7) ?
Transcribed Image Text:Lab 3 - Word
Khalia Merriweather
Layout
References
Mailings
Review
View
Help
O Tell me what you want to do
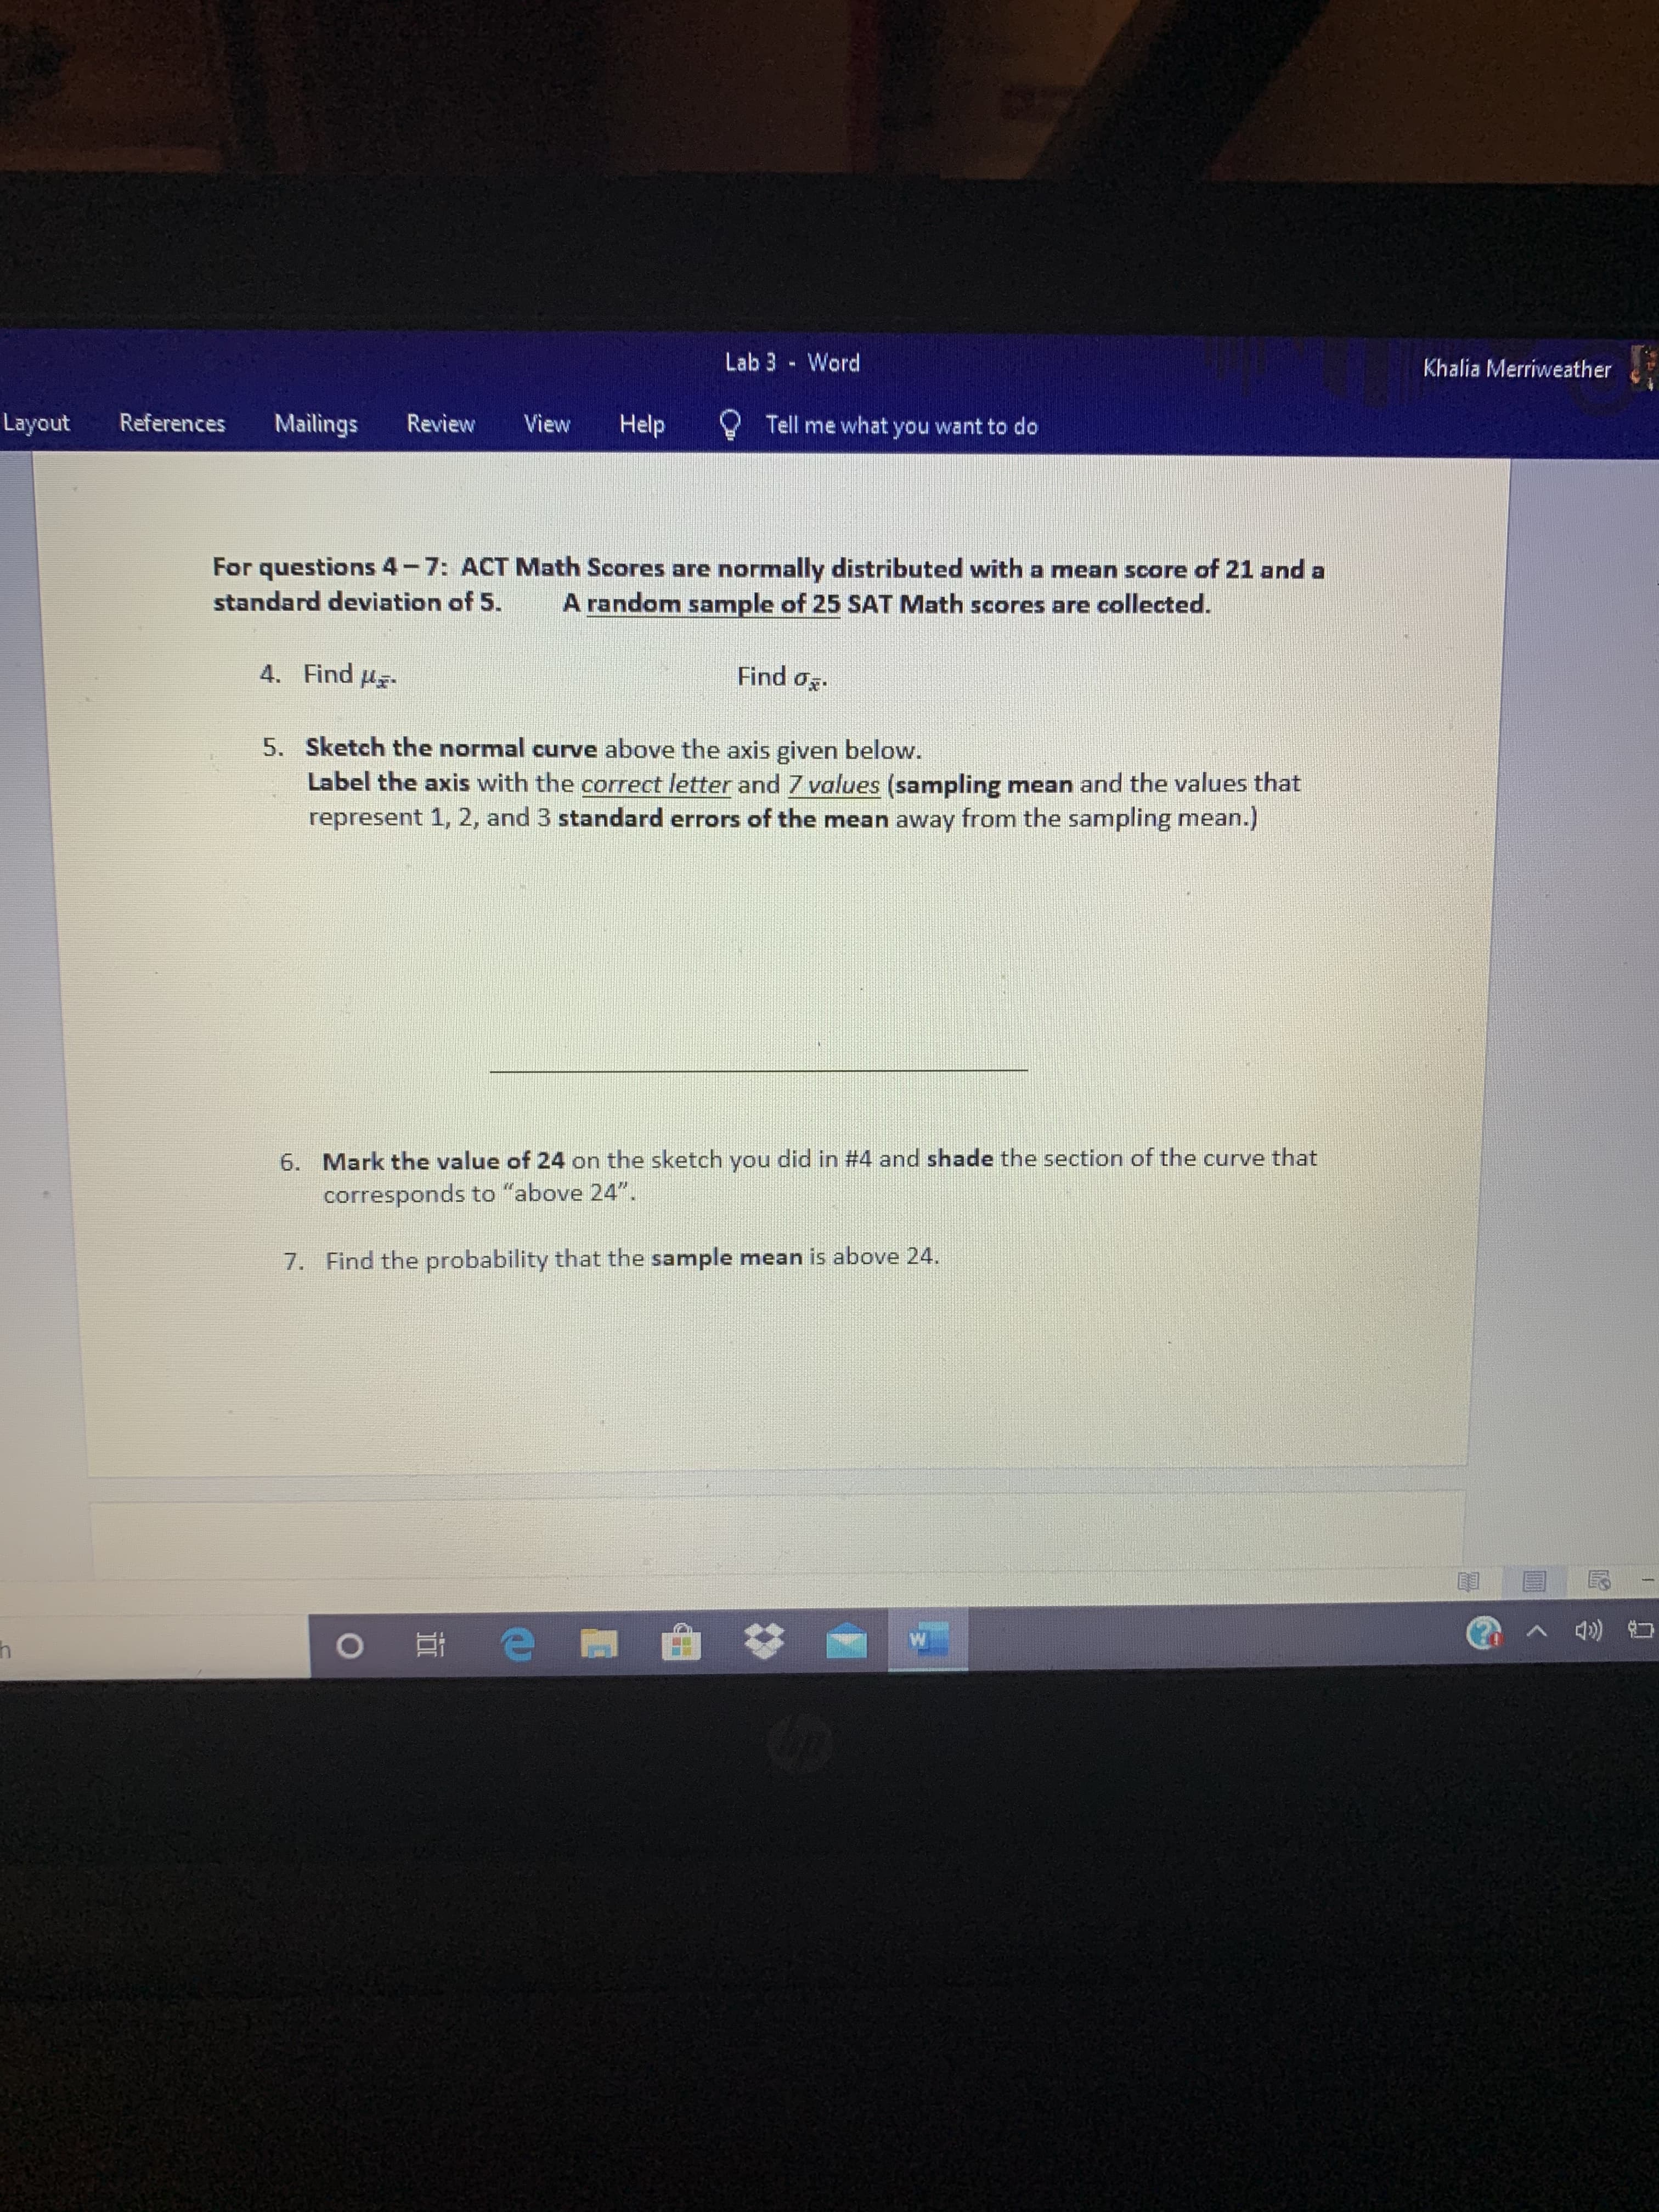
For questions 4-7: ACT Math Scores are normally distributed with a mean score of 21 and a
standard deviation of 5.
A random sample of 25 SAT Math scores are collected.
4. Find Hz-
Find og.
5. Sketch the normal curve above the axis given below.
Label the axis with the correct letter and 7 values (sampling mean and the values that
represent 1, 2, and 3 standard errors of the mean away from the sampling mean.)
6. Mark the value of 24 on the sketch you did in #4 and shade the section of the curve that
corresponds to "above 24".
7. Find the probability that the sample mean is above 24.
Expert Solution
This question has been solved!
Explore an expertly crafted, step-by-step solution for a thorough understanding of key concepts.

This is a popular solution!

Trending now
This is a popular solution!

Step by step
Solved in 4 steps with 12 images

Knowledge Booster


Learn more about
Need a deep-dive on the concept behind this application? Look no further. Learn more about this topic, statistics and related others by exploring similar questions and additional content below.Recommended textbooks for you
Glencoe Algebra 1, Student Edition, 9780079039897…
Algebra
ISBN:
9780079039897
Author:
Carter
Publisher:
McGraw Hill
Glencoe Algebra 1, Student Edition, 9780079039897…
Algebra
ISBN:
9780079039897
Author:
Carter
Publisher:
McGraw Hill