Let random variable Q represent the number of employees who work at a certain restaurant on a given day. The following table shows the probability distribution of the random variable Q Number of Employees Probability 20 21 22 23 0.1 0.1 0.1 0.4 24 0.3 Which of the following claims is best supported by the table?
Let random variable Q represent the number of employees who work at a certain restaurant on a given day. The following table shows the probability distribution of the random variable Q Number of Employees Probability 20 21 22 23 0.1 0.1 0.1 0.4 24 0.3 Which of the following claims is best supported by the table?

Chapter8: Sequences, Series,and Probability
Section8.7: Probability
Problem 11ECP: A manufacturer has determined that a machine averages one faulty unit for every 500 it produces....

Related questions
Question
A. The most likely number of employees who work on a given day is 24
B. The
work on a given day.
C. The mean number of employees who work on a given day is greater than the median number of employees
who work on a given day.
D. The mean number of employees who work on a given day is less than the median number of employees who
work on a given day.
E. On a given day, the number of employees who work at the restaurant occurs with equal probabilities.
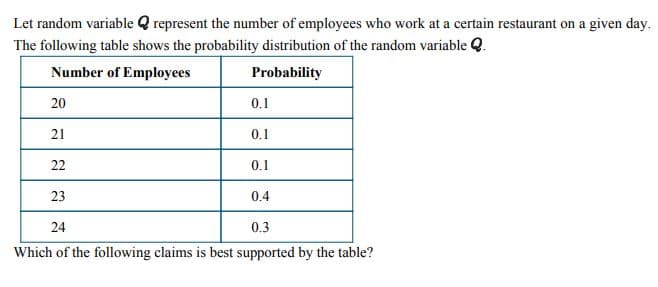
Transcribed Image Text:Let random variable Q represent the number of employees who work at a certain restaurant on a given day.
The following table shows the probability distribution of the random variable Q
Number of Employees
Probability
20
21
22
23
0.1
0.1
0.1
0.4
24
0.3
Which of the following claims is best supported by the table?
AI-Generated Solution

Unlock instant AI solutions
Tap the button
to generate a solution
Recommended textbooks for you