Let x be a random variable that represents hemoglobin count (HC) in grams per 100 milliliters of whole blood. Then x has a distribution that is approximately normal, with population mean of about 14 for healthy adult women. Suppose that a female patient has taken 10 laboratory blood tests during the past year. The HC data sent to the patient's doctor are as follows. 14 19| 17 19 | 14 | 13 | 14 | 16 | 16 | 11 n USE SALT (a) Use a calculator with sample mean and standard deviation keys to find x and s. (Round your answers to two decimal places.) x = (b) Does this information indicate that the population average HC for this patient is higher than 14? Use a = 0.01. (i) What is the level of significance? State the null and alternate hypotheses. O Ho: H < 14; H1: µ = 14 O Ho: H = 14; H;: µ < 14 O Ho: H = 14; H,:H# 14 Ο Η: μ- 14; H: μ > 14 O Ho: H> 14; Hạ: µ = 14 (ii) What sampling distribution will you use? Explain the rationale for your choice of sampling distribution. O The standard normal, since we assume that x has a normal distribution and o is known. O The Student's t, since we assume that x has a normal distribution and o is known. O The standard normal, since we assume that x has a normal distribution and o is unknown. O The Student's t, since we assume that x has a normal distribution and o is unknown. What is the value of the sample test statistic? (Round your answer to three decimal places.) (iii) Estimate the P-value. O P-value > 0.250 O 0.200 < P-value < 0.250 O 0.075 < P-value < 0.200 O 0.050 < P-value < 0.075 O P-value < 0.050
Let x be a random variable that represents hemoglobin count (HC) in grams per 100 milliliters of whole blood. Then x has a distribution that is approximately normal, with population mean of about 14 for healthy adult women. Suppose that a female patient has taken 10 laboratory blood tests during the past year. The HC data sent to the patient's doctor are as follows. 14 19| 17 19 | 14 | 13 | 14 | 16 | 16 | 11 n USE SALT (a) Use a calculator with sample mean and standard deviation keys to find x and s. (Round your answers to two decimal places.) x = (b) Does this information indicate that the population average HC for this patient is higher than 14? Use a = 0.01. (i) What is the level of significance? State the null and alternate hypotheses. O Ho: H < 14; H1: µ = 14 O Ho: H = 14; H;: µ < 14 O Ho: H = 14; H,:H# 14 Ο Η: μ- 14; H: μ > 14 O Ho: H> 14; Hạ: µ = 14 (ii) What sampling distribution will you use? Explain the rationale for your choice of sampling distribution. O The standard normal, since we assume that x has a normal distribution and o is known. O The Student's t, since we assume that x has a normal distribution and o is known. O The standard normal, since we assume that x has a normal distribution and o is unknown. O The Student's t, since we assume that x has a normal distribution and o is unknown. What is the value of the sample test statistic? (Round your answer to three decimal places.) (iii) Estimate the P-value. O P-value > 0.250 O 0.200 < P-value < 0.250 O 0.075 < P-value < 0.200 O 0.050 < P-value < 0.075 O P-value < 0.050

Holt Mcdougal Larson Pre-algebra: Student Edition 2012
1st Edition
ISBN:9780547587776
Author:HOLT MCDOUGAL
Publisher:HOLT MCDOUGAL
Chapter11: Data Analysis And Probability
Section: Chapter Questions
Problem 8CR

Related questions
Topic Video
Question
Let x be a random variable that represents hemoglobin count (HC) in grams per 100 milliliters of whole blood. Then x has a distribution that is approximately normal, with population mean of about 14 for healthy adult women. Suppose that a female patient has taken 10 laboratory blood tests during the past year. The HC data sent to the patient's doctor are as follows.
| 14 | 19 | 17 | 19 | 14 | 13 | 14 | 16 | 16 | 11 |
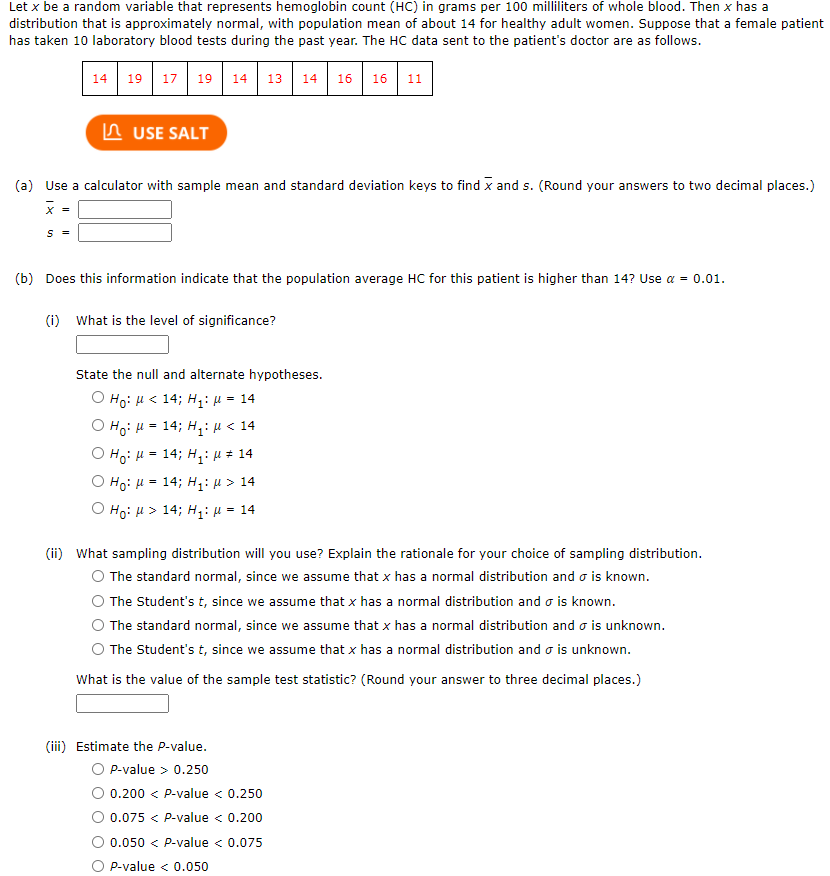
Transcribed Image Text:Let x be a random variable that represents hemoglobin count (HC) in grams per 100 milliliters of whole blood. Then x has a
distribution that is approximately normal, with population mean of about 14 for healthy adult women. Suppose that a female patient
has taken 10 laboratory blood tests during the past year. The HC data sent to the patient's doctor are as follows.
14 19 17 19 14
13 14
16
16 11
A USE SALT
(a) Use a calculator with sample mean and standard deviation keys to find x and s. (Round your answers to two decimal places.)
x =
(b) Does this information indicate that the population average HC for this patient is higher than 14? Use a = 0.01.
(i) What is the level of significance?
State the null and alternate hypotheses.
О но: и < 14; н:и - 14
O Ho: H = 14; H,: µ < 14
O Ho: H = 14; H,: µ # 14
%3D
O Ho: H = 14; H: µ > 14
O Ho: H > 14; H: µ = 14
(ii) What sampling distribution will you use? Explain the rationale for your choice of sampling distribution.
O The standard normal, since we assume that x has a normal distribution and o is known.
The Student's t, since we assume that x has a normal distribution and o is known.
The standard normal, since we assume that x has a normal distribution and o is unknown.
The Student's t, since we assume that x has a normal distribution and o is unknown.
What is the value of the sample test statistic? (Round your answer to three decimal places.)
(iii) Estimate the P-value.
P-value > 0.250
0.200 < P-value < 0.250
0.075 < P-value < 0.200
0.050 < P-value < 0.075
P-value < 0.050
Expert Solution
This question has been solved!
Explore an expertly crafted, step-by-step solution for a thorough understanding of key concepts.

This is a popular solution!

Trending now
This is a popular solution!

Step by step
Solved in 2 steps with 5 images

Knowledge Booster


Learn more about
Need a deep-dive on the concept behind this application? Look no further. Learn more about this topic, statistics and related others by exploring similar questions and additional content below.Recommended textbooks for you
Holt Mcdougal Larson Pre-algebra: Student Edition…
Algebra
ISBN:
9780547587776
Author:
HOLT MCDOUGAL
Publisher:
HOLT MCDOUGAL
Holt Mcdougal Larson Pre-algebra: Student Edition…
Algebra
ISBN:
9780547587776
Author:
HOLT MCDOUGAL
Publisher:
HOLT MCDOUGAL