Let X, represent the Total Worldwide Revenues (Smillions) and let X2 represent the FT Voluntary Turnover (%). (Round the constant and X2-coefficient to the nearest integer as needed. Round the Xq-coefficient to four decimal places as needed.) b. Interpret the meanings of the slopes b; and by in this problem. Choose the correct answer below. O A. For each increase of 1 in both Revenue and Turnover, the Jobs Added is estimated to increase by b, + bą. O B. The slopes b, and b2 cannot be interpreted individually. OC. For a given Turnover, for each increase of $1 million in Revenue, the Jobs Added is estimated to increase by by. For a given Revenue, for each increase 1% in Turnover, the numb O D. For each increase of 1 in Jobs Added, the Revenue is estimated to increase by Sb; million and the Turmover percentage is es increase by by %. stimated toin c. Interpret the meaning of the regression coefficient, bg. Select the correct choice below. O A. The coefficient bo represents the total worldwide revenue and a voluntary turnover. O B. The coefficient bọ represents the estimated number of total jobs added when there is a total worldwide revenue of $0 and a voluntary turnover of 0%. OC. The coefficient bo represents the estimated number of total jobs added when there is a voluntary turnover of 0%. O D. The coefficient bọ represents the estimated number of total jobs added when there is a total worldwide revenue of S0.
Let X, represent the Total Worldwide Revenues (Smillions) and let X2 represent the FT Voluntary Turnover (%). (Round the constant and X2-coefficient to the nearest integer as needed. Round the Xq-coefficient to four decimal places as needed.) b. Interpret the meanings of the slopes b; and by in this problem. Choose the correct answer below. O A. For each increase of 1 in both Revenue and Turnover, the Jobs Added is estimated to increase by b, + bą. O B. The slopes b, and b2 cannot be interpreted individually. OC. For a given Turnover, for each increase of $1 million in Revenue, the Jobs Added is estimated to increase by by. For a given Revenue, for each increase 1% in Turnover, the numb O D. For each increase of 1 in Jobs Added, the Revenue is estimated to increase by Sb; million and the Turmover percentage is es increase by by %. stimated toin c. Interpret the meaning of the regression coefficient, bg. Select the correct choice below. O A. The coefficient bo represents the total worldwide revenue and a voluntary turnover. O B. The coefficient bọ represents the estimated number of total jobs added when there is a total worldwide revenue of $0 and a voluntary turnover of 0%. OC. The coefficient bo represents the estimated number of total jobs added when there is a voluntary turnover of 0%. O D. The coefficient bọ represents the estimated number of total jobs added when there is a total worldwide revenue of S0.

Glencoe Algebra 1, Student Edition, 9780079039897, 0079039898, 2018
18th Edition
ISBN:9780079039897
Author:Carter
Publisher:Carter
Chapter10: Statistics
Section: Chapter Questions
Problem 8SGR

Related questions
Question
Please answer all questions fully, data included:
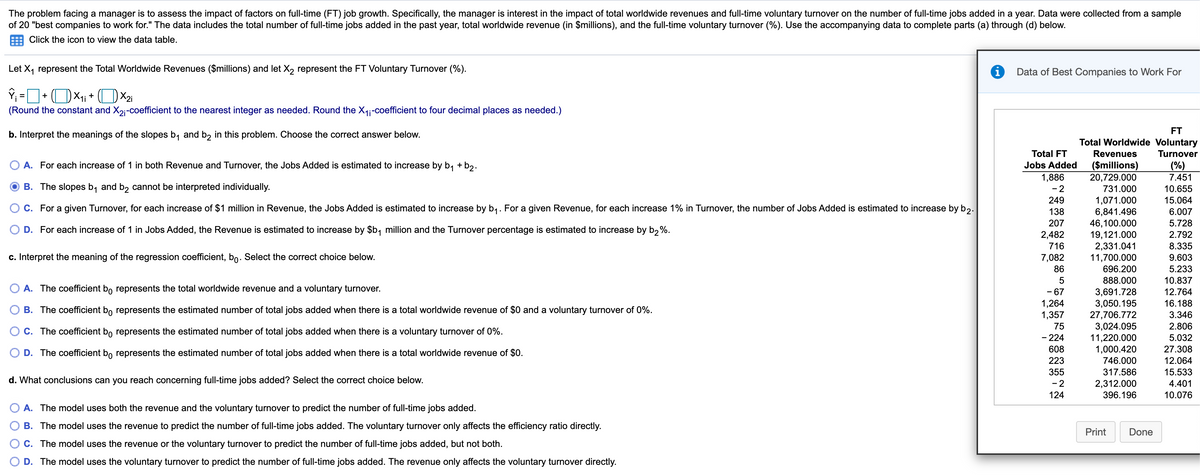
The problem facing a manager is to assess the impact of factors on full-time (FT) job growth. Specifically, the manager is interest in the impact of total worldwide revenues and full-time voluntary turnover on the number of full-time jobs added in a year. Data were collected from a sample of 20 "best companies to work for." The data includes the total number of full-time jobs added in the past year, total worldwide revenue (in $millions), and the full-time voluntary turnover (%). Use the accompanying data to complete parts (a) through (d) below.
Transcribed Image Text:The problem facing a manager is to assess the impact of factors on full-time (FT) job growth. Specifically, the manager is interest in the impact of total worldwide revenues and full-time voluntary turnover on the number of full-time jobs added in a year. Data were collected from a sample
of 20 "best companies to work for." The data includes the total number of full-time jobs added in the past year, total worldwide revenue (in $millions), and the full-time voluntary turnover (%). Use the accompanying data to complete parts (a) through (d) below.
Click the icon to view the data table.
Let X, represent the Total Worldwide Revenues ($millions) and let X2 represent the FT Voluntary Turnover (%).
i
Data of Best Companies to Work For
ŷ; =D+ (O X1 + (D X2
(Round the constant and X2;-coefficient to the nearest integer as needed. Round the X4;-coefficient to four decimal places as needed.)
FT
b. Interpret the meanings of the slopes b, and b2 in this problem. Choose the correct answer below.
Total Worldwide Voluntary
Total FT
Revenues
Turnover
O A. For each increase of 1 in both Revenue and Turnover, the Jobs Added is estimated to increase by b, + b2.
Jobs Added
($millions)
20,729.000
(%)
1,886
- 2
7.451
B. The slopes b, and b2 cannot be interpreted individually.
731.000
10.655
249
1,071.000
6,841.496
46,100.000
19,121.000
2,331.041
11,700.000
15.064
C. For a given Turnover, for each increase of $1 million in Revenue, the Jobs Added is estimated to increase by b,. For a given Revenue, for each increase 1% in Turnover, the number of Jobs Added is estimated to increase by b2.
138
6.007
207
5.728
D. For each increase of 1 in Jobs Added, the Revenue is estimated to increase by $b, million and the Turnover percentage is estimated to increase by b,%.
2.792
2,482
716
8.335
c. Interpret the meaning of the regression coefficient, bo. Select the correct choice below.
7,082
9.603
86
696.200
5.233
888.000
10.837
A. The coefficient bo represents the total worldwide revenue and a voluntary turnover.
3,691.728
3,050.195
27,706.772
3,024.095
11,220.000
1,000.420
746.000
- 67
1,264
1,357
12.764
16.188
B. The coefficient bo represents the estimated number of total jobs added when there is a total worldwide revenue of $0 and a voluntary turnover of 0%.
3.346
75
2.806
C. The coefficient bo represents the estimated number of total jobs added when there is a voluntary turnover of 0%.
- 224
5.032
608
27.308
D. The coefficient bo represents the estimated number of total jobs added when there is a total worldwide revenue of $0.
223
12.064
355
317.586
15.533
d. What conclusions can you reach concerning full-time jobs added? Select the correct choice below.
- 2
2,312.000
4.401
124
396.196
10.076
A. The model uses both the revenue and the voluntary turnover to predict the number of full-time jobs added.
B. The model uses the revenue to predict the number of full-time jobs added. The voluntary turnover only affects the efficiency ratio directly.
Print
Done
C. The model uses the revenue or the voluntary turnover to predict the number of full-time jobs added, but not both.
D. The model uses the voluntary turnover to predict the number of full-time jobs added. The revenue only affects the voluntary turnover directly.
Expert Solution
This question has been solved!
Explore an expertly crafted, step-by-step solution for a thorough understanding of key concepts.

This is a popular solution!

Trending now
This is a popular solution!

Step by step
Solved in 4 steps

Knowledge Booster


Learn more about
Need a deep-dive on the concept behind this application? Look no further. Learn more about this topic, statistics and related others by exploring similar questions and additional content below.Recommended textbooks for you
Glencoe Algebra 1, Student Edition, 9780079039897…
Algebra
ISBN:
9780079039897
Author:
Carter
Publisher:
McGraw Hill

Big Ideas Math A Bridge To Success Algebra 1: Stu…
Algebra
ISBN:
9781680331141
Author:
HOUGHTON MIFFLIN HARCOURT
Publisher:
Houghton Mifflin Harcourt
Glencoe Algebra 1, Student Edition, 9780079039897…
Algebra
ISBN:
9780079039897
Author:
Carter
Publisher:
McGraw Hill
Big Ideas Math A Bridge To Success Algebra 1: Stu…
Algebra
ISBN:
9781680331141
Author:
HOUGHTON MIFFLIN HARCOURT
Publisher:
Houghton Mifflin Harcourt