Let's Analyze Consider the table and velocity vs. time graph below. Convert it into an acceleration vs. time a vs. graph. Tame (1) Velocity (mt Velocity vs. Time Graph 35 30 10 10 10 30 10 15 15 30 Time (s) 20 20 velocity (m's)
Let's Analyze Consider the table and velocity vs. time graph below. Convert it into an acceleration vs. time a vs. graph. Tame (1) Velocity (mt Velocity vs. Time Graph 35 30 10 10 10 30 10 15 15 30 Time (s) 20 20 velocity (m's)

Glencoe Physics: Principles and Problems, Student Edition
1st Edition
ISBN:9780078807213
Author:Paul W. Zitzewitz
Publisher:Paul W. Zitzewitz
Chapter3: Accelerated Motion
Section: Chapter Questions
Problem 55A

Related questions
Question
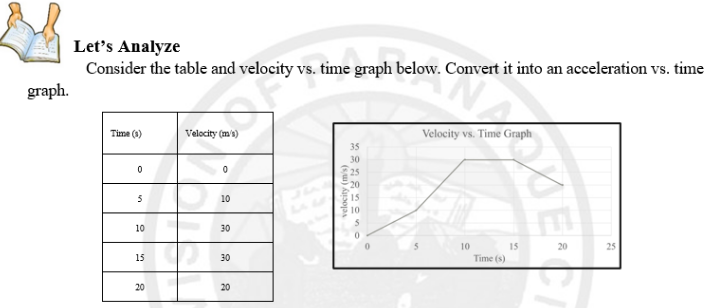
Transcribed Image Text:Let's Analyze
Consider the table and velocity vs. time graph below. Convert it into an acceleration vs. time
graph.
Time (1)
Velocity (m's)
Velocity vs. Time Graph
35
30
25
20
5
10
15
10
10
30
10
15
20
25
15
30
Time (s)
20
20
velocity (m's)
Expert Solution
This question has been solved!
Explore an expertly crafted, step-by-step solution for a thorough understanding of key concepts.

Step by step
Solved in 2 steps with 2 images

Recommended textbooks for you
Glencoe Physics: Principles and Problems, Student…
Physics
ISBN:
9780078807213
Author:
Paul W. Zitzewitz
Publisher:
Glencoe/McGraw-Hill
Glencoe Physics: Principles and Problems, Student…
Physics
ISBN:
9780078807213
Author:
Paul W. Zitzewitz
Publisher:
Glencoe/McGraw-Hill