Let's use SPSS to run a one-sample t-test! Imagine that you are interested in whether the number of hours students in a statistics course work each week differs from the average number of hours reported by the general student body at ASU. Thankfully, you have a data set that consists of information from students in a statistics course, including how many hours they work each week ("workhours"). You also happen to know that the average number of hours worked each week by the general student population at ASU is 25. Use the data provided to conduct a one sample t-test in SPSS comparing the sample data to the population mean.. The dependent variable for your test should be "workhours". Based on your output, the average number of hours worked each week by a sample is ________ . Enter your answer rounded to two decimal places (i.e., 10.01, not 10.1, not 10.0, not 10.010).


Let's use SPSS to run a one-sample t-test! Imagine that you are interested in whether the number of hours students in a statistics course work each week differs from the average number of hours reported by the general student body at ASU. Thankfully, you have a data set that consists of information from students in a statistics course, including how many hours they work each week ("workhours"). You also happen to know that the average number of hours worked each week by the general student population at ASU is 25. Use the data provided to conduct a one sample t-test in SPSS comparing the sample data to the population mean.. The dependent variable for your test should be "workhours".
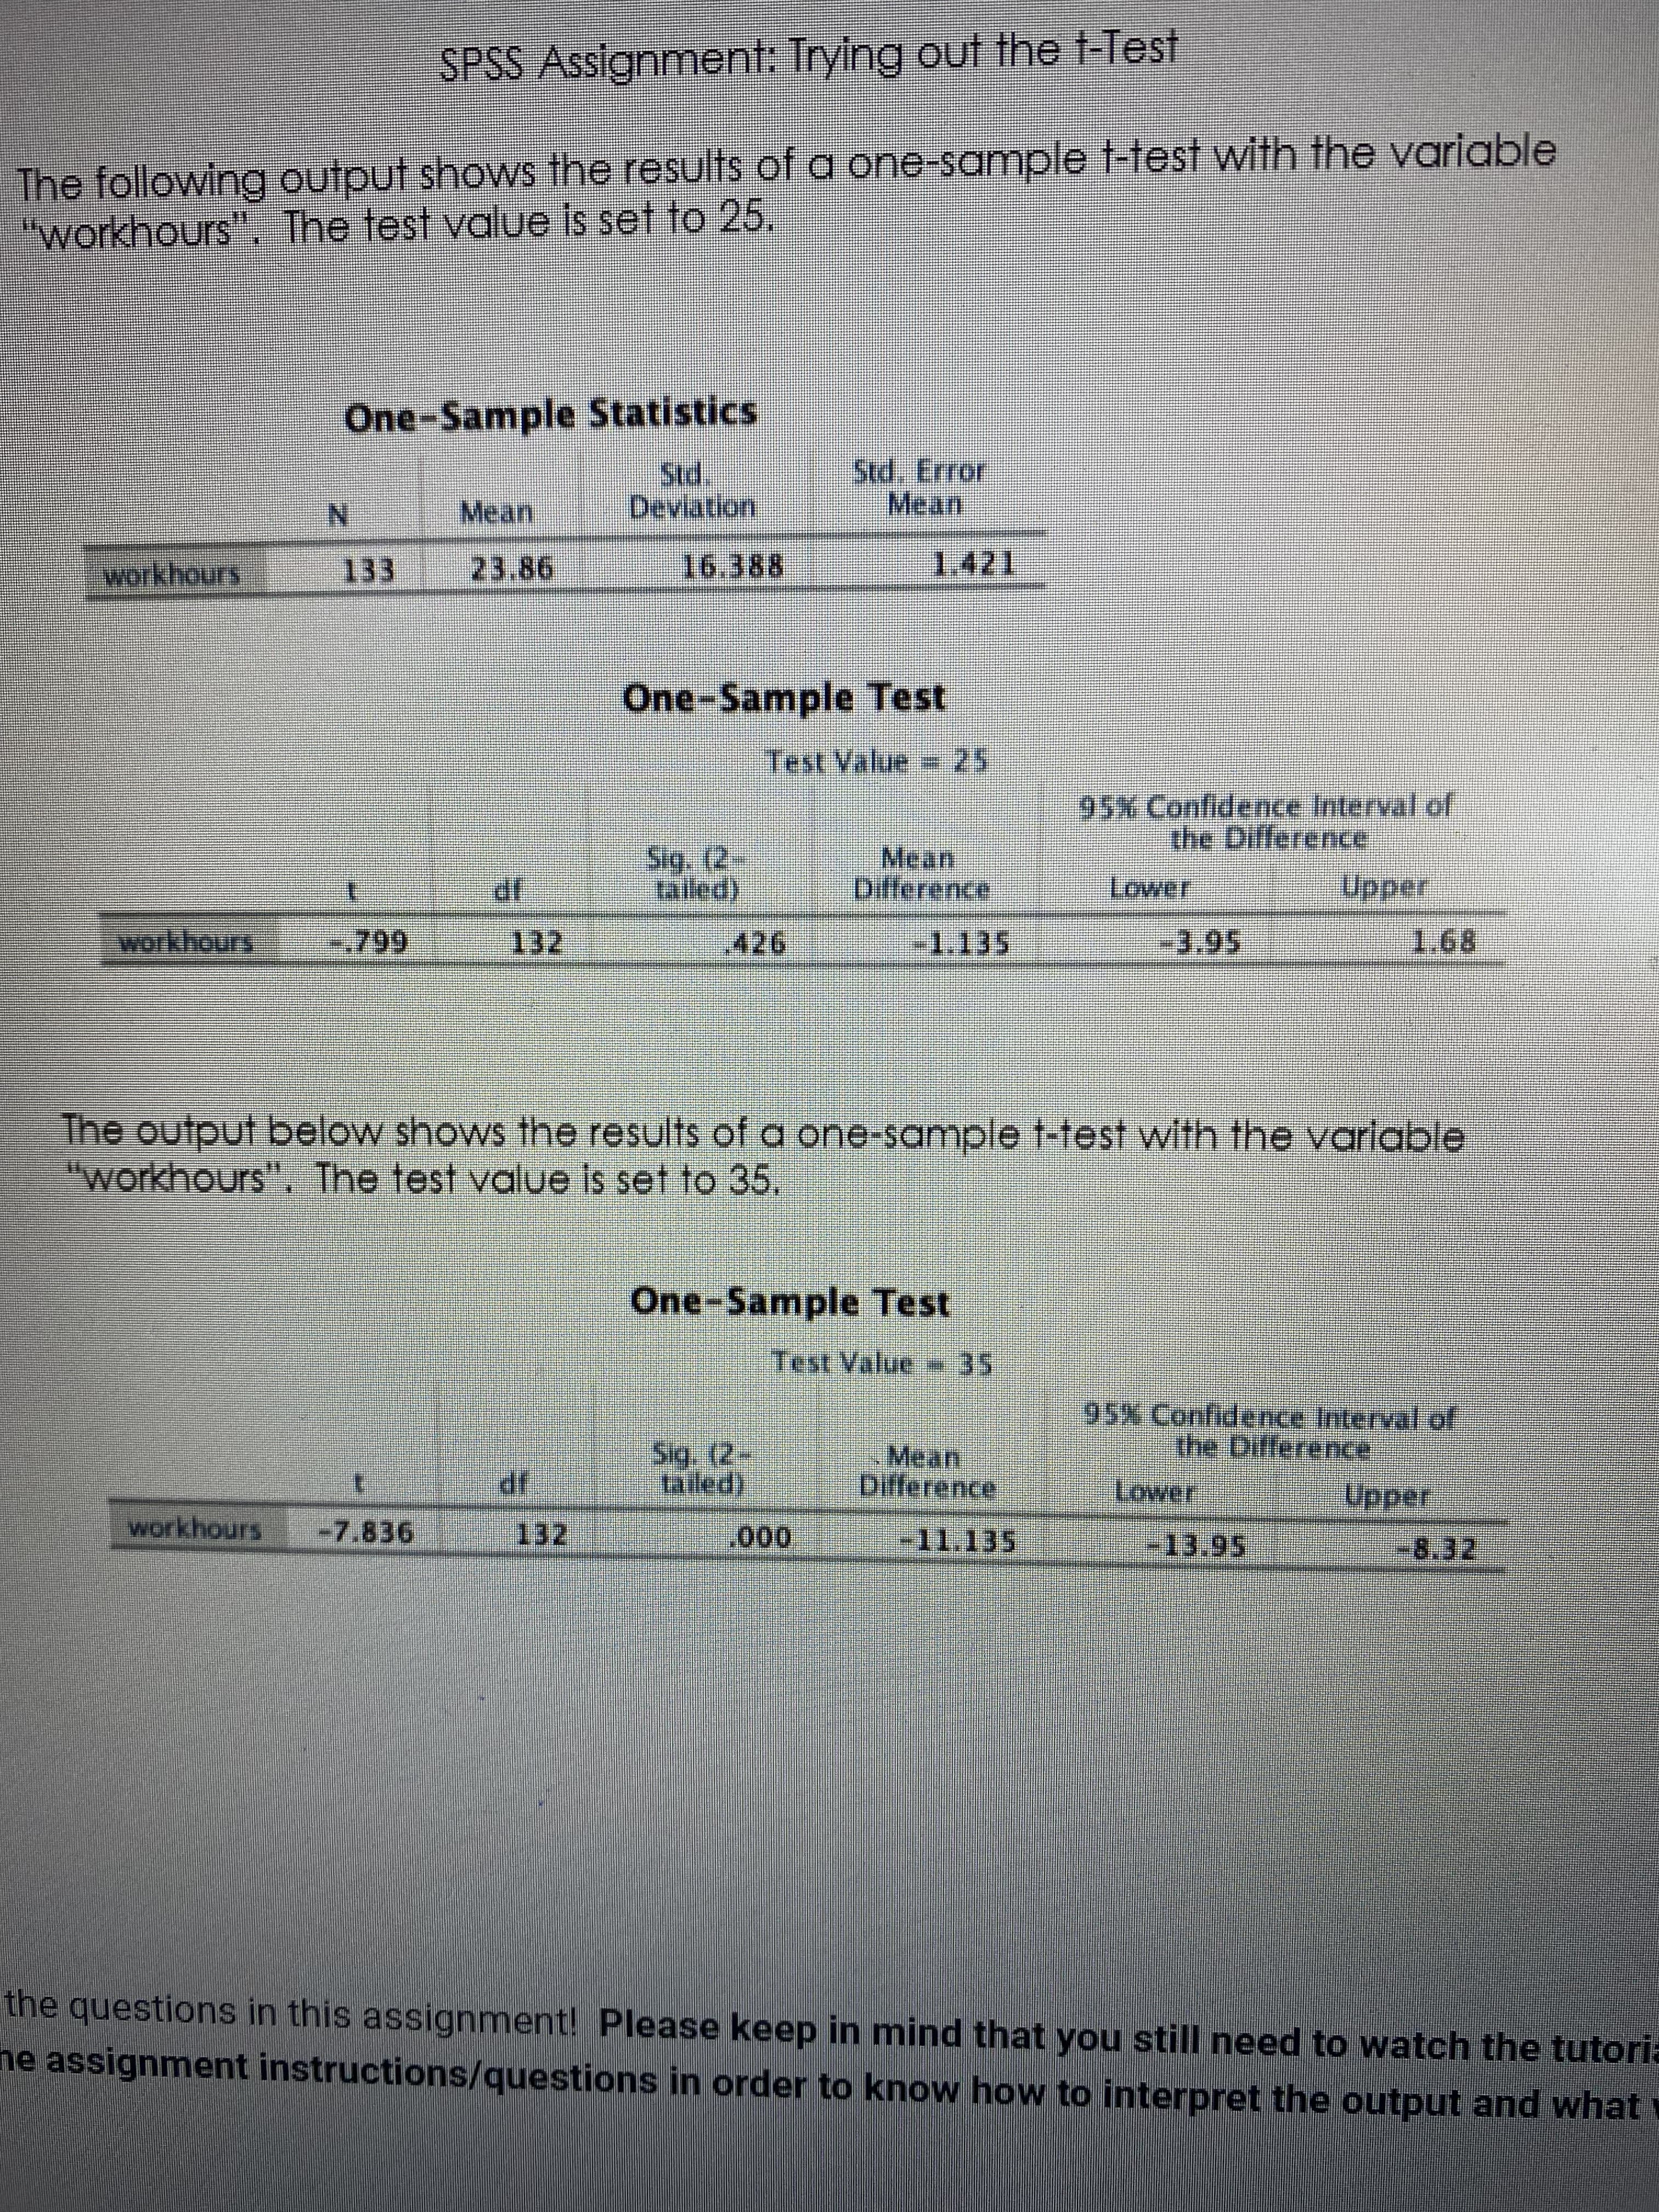
Based on your output, the average number of hours worked each week by a sample is ________ . Enter your answer rounded to two decimal places (i.e., 10.01, not 10.1, not 10.0, not 10.010).
Given:
Hypothesis output

Trending now
This is a popular solution!

Step by step
Solved in 2 steps
