Levi-Strauss Co manufactures clothing. The quality control department measures weekly values of different suppliers for the percentage difference of waste between the layout on the computer and the actual waste when the clothing is made (called run-up). The data is in the table, and there are some negative values because sometimes the supplier is able to layout the pattern better than the computer. Do the data show that there is a difference between some of the suppliers? Test at the 1% level. Run-ups for Different Plants Making Levi Strauss Clothing Plant Difference Plant 1 2.4 Plant 1 Plant 1 Plant 1 Plant 1 Plant 1 Plant 1 Plant 1 Plant 1 Plant 1 Plant 1 Plant 1 Plant 1 Plant 1 Plant 1 Plant 1 Plant 1 Plant 1 Plant 1 Plant 1 Plant 1 Plant 1 Plant 2 Plant 2 Plant 2 Plant 2 Plant 2 Plant 2 Plant 2 Plant 2 Plant 2 Plant 2 Plant 2 Plant 2 Plant 2 Plant 2 Plant 2 Plant 2 Plant 2 Plant 2 Plant 2 Plant 2 Plant 2 Plant 2 Plant 3 Plant 3 Plant 3 Plant 3 Plant 3 Plant 3 Plant 3 Plant 3 Plant 3 Plant 3 Plant 3 Plant 3 Plant 3 Plant 3 Plant 3 Plant 3 Plant 3 Plant 3 Plant 3 Plant 4 Plant 4 Plant 4 Plant 4 Plant 4 Plant 4 Plant 4 Plant 4 Plant 4 Plant 4 Plant 4 Plant 4 Plant 4 Plant 4 Plant 4 Plant 4 Plant 4 Plant 4 Plant 4 Plant 5 Plant 5 Plant 5 Plant 5 Plant 5 Plant 5 Plant 5 Plant 5 Plant 5 Plant 5 Plant 5 Plant 5 Plant 5 Plant 5 Plant 5 12.6 13.1 2.3 17.3 4.1 -5.4 1.9 16 -3.9 -6.2 0 3 1 42.8 20 10.9 24.6 -0.2 14.6 18.1 -2.5 0.6 29.4 34.9 -10.6 4 24.8 26.8 -38.5 27.7 6.5 1.8 8.8 9.2 -0.2 8.7 0.2 1.1 5.9 2.1 9 5.8 -5.8 9 2.4 7.5 11.2 14,7 3.1 9.2 11.3 0.5 2.9 10.1 7.6 10.8 5.6 6.2 3.6 4 -6.3 32.1 -1.1 25.1 9 11.1 -2.4 8.3 19.6 2.2 4.9 State the hypotheses. H₂: Select an answer H₂: Select an answer Calculate the test statistic. Round to two decimal places. Calculate the p-value. Round to four decimal places. p-value= State your decision. Since p-value (0.01, [Select an answer V Ho Interpret the results. At the 1% significance level, there [Select an answer V evidence to show that Belect an answer a difference between some of the suppliers.
Levi-Strauss Co manufactures clothing. The quality control department measures weekly values of different suppliers for the percentage difference of waste between the layout on the computer and the actual waste when the clothing is made (called run-up). The data is in the table, and there are some negative values because sometimes the supplier is able to layout the pattern better than the computer. Do the data show that there is a difference between some of the suppliers? Test at the 1% level. Run-ups for Different Plants Making Levi Strauss Clothing Plant Difference Plant 1 2.4 Plant 1 Plant 1 Plant 1 Plant 1 Plant 1 Plant 1 Plant 1 Plant 1 Plant 1 Plant 1 Plant 1 Plant 1 Plant 1 Plant 1 Plant 1 Plant 1 Plant 1 Plant 1 Plant 1 Plant 1 Plant 1 Plant 2 Plant 2 Plant 2 Plant 2 Plant 2 Plant 2 Plant 2 Plant 2 Plant 2 Plant 2 Plant 2 Plant 2 Plant 2 Plant 2 Plant 2 Plant 2 Plant 2 Plant 2 Plant 2 Plant 2 Plant 2 Plant 2 Plant 3 Plant 3 Plant 3 Plant 3 Plant 3 Plant 3 Plant 3 Plant 3 Plant 3 Plant 3 Plant 3 Plant 3 Plant 3 Plant 3 Plant 3 Plant 3 Plant 3 Plant 3 Plant 3 Plant 4 Plant 4 Plant 4 Plant 4 Plant 4 Plant 4 Plant 4 Plant 4 Plant 4 Plant 4 Plant 4 Plant 4 Plant 4 Plant 4 Plant 4 Plant 4 Plant 4 Plant 4 Plant 4 Plant 5 Plant 5 Plant 5 Plant 5 Plant 5 Plant 5 Plant 5 Plant 5 Plant 5 Plant 5 Plant 5 Plant 5 Plant 5 Plant 5 Plant 5 12.6 13.1 2.3 17.3 4.1 -5.4 1.9 16 -3.9 -6.2 0 3 1 42.8 20 10.9 24.6 -0.2 14.6 18.1 -2.5 0.6 29.4 34.9 -10.6 4 24.8 26.8 -38.5 27.7 6.5 1.8 8.8 9.2 -0.2 8.7 0.2 1.1 5.9 2.1 9 5.8 -5.8 9 2.4 7.5 11.2 14,7 3.1 9.2 11.3 0.5 2.9 10.1 7.6 10.8 5.6 6.2 3.6 4 -6.3 32.1 -1.1 25.1 9 11.1 -2.4 8.3 19.6 2.2 4.9 State the hypotheses. H₂: Select an answer H₂: Select an answer Calculate the test statistic. Round to two decimal places. Calculate the p-value. Round to four decimal places. p-value= State your decision. Since p-value (0.01, [Select an answer V Ho Interpret the results. At the 1% significance level, there [Select an answer V evidence to show that Belect an answer a difference between some of the suppliers.

Glencoe Algebra 1, Student Edition, 9780079039897, 0079039898, 2018
18th Edition
ISBN:9780079039897
Author:Carter
Publisher:Carter
Chapter10: Statistics
Section10.6: Summarizing Categorical Data
Problem 10CYU

Related questions
Question
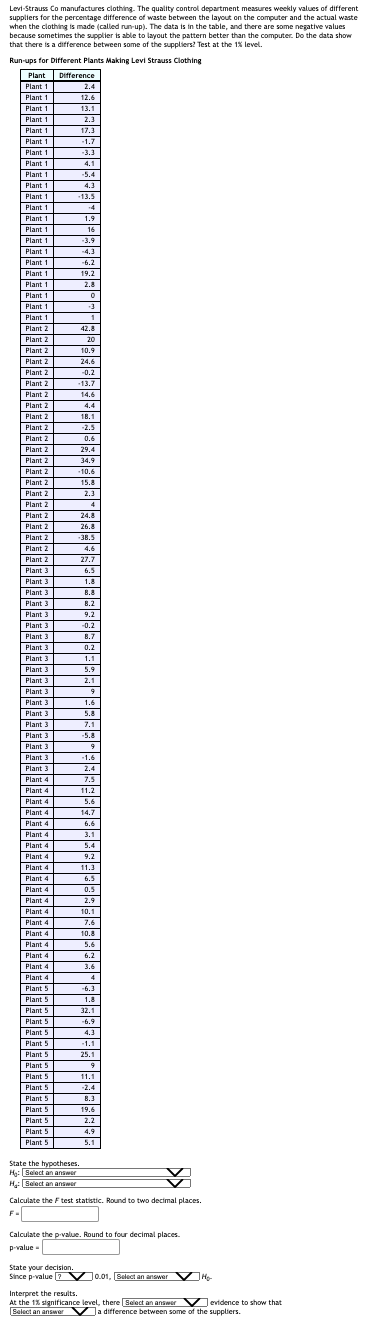
Transcribed Image Text:Levi-Strauss Co manufactures clothing. The quality control department measures weekly values of different
suppliers for the percentage difference of waste between the layout on the computer and the actual waste
when the clothing is made (called run-up). The data is in the table, and there are some negative values
because sometimes the supplier is able to layout the pattern better than the computer. Do the data show
that there is a difference between some of the suppliers? Test at the 1% level.
Run-ups for Different Plants Making Levi Strauss Clothing
Plant
Plant 1
Plant 1
Plant 1
Plant 1
Plant 1
Plant 1
Plant 1
Plant 1
Plant 1
Plant 1
Plant 1
Plant 1
Plant 1
Plant 1
Plant 1
Plant 1
Plant 1
Plant 1
Plant 1
Plant 1
Plant 1
Plant 1
Plant 2
Plant 2
Plant 2
Plant 2
Plant 2
Plant 2
Plant 2
Plant 2
Plant 2
Plant 2
Plant 2
Plant 2
Plant 2
Plant 2
Plant 2
Plant 2
Plant 2
Plant 2
Plant 2
Plant 2
Plant 2
Plant 2
Plant 3
Plant 3
Plant 3
Plant 3
Plant 3
Plant 3
Plant 3
Plant 3
Plant 3
Plant 3
Plant 3
Plant 3
Plant 3
Plant 3
Plant 3
Plant 3
Plant 3
Plant 3
Plant 3
Plant 4
Plant 4
Plant 4
Plant 4
Plant 4
Plant 4
Plant 4
Plant 4
Plant 4
Plant 4
Plant 4
Plant 4
Plant 4
Plant 4
Plant 4
Plant 4
Plant 4
Plant 4
Plant 4
Plant 5
Plant 5
Plant 5
Plant 5
Plant 5
Plant 5
Plant 5
Plant 5
Plant 5
Plant 5
Plant 5
Plant 5
Plant 5
Plant 5
Plant 5
Difference
2.4
12.6
13.1
2.3
…
17.3
-1.7
-3.3
4.1
-5.4
4.3
-13.5
-4
1.9
16
-3.9
-4.3
-6.2
19.2
2.8
0
-3
1
42.8
20
10.9
24.6
-0.2
-13.7
14.6
4.4
18.1
-2.5
0.6
29.4
34.9
-10.6
15.8
21
2.3
4
24.8
26.8
-38.5
4.6
27.7
6.5
1.8
8.8
8.2
9.2
-0.2
8.7
0.2
1.1
FO
5.9
2.1
9
1.6
5.8
7.1
9
-1.6
2.4
7.5
11.2
5.6
14.7
6.6
3.1
54
5.4
9.2
11.3
6.5
0.5
2.9
10.1
7.6
10.8
5.6
6.2
3.6
4
-6.3
1.8
32.1
-6.9
4.3
-1.1
25.1
9
11.1
-2.4
8.3
19.6
2.2
4.9
5.1
State the hypotheses
Ho: Select an answer
H₂: Select an answer
Calculate the F test statistic. Round to two decimal places.
F=
Calculate the p-value. Round to four decimal places.
p-value=
State your decision.
Since p-value? V 0.01, Select an answer Ho
Interpret the results.
At the 1% significance level, there [Select an answer
Select an answer
evidence to show that
a difference between some of the suppliers.
Expert Solution
This question has been solved!
Explore an expertly crafted, step-by-step solution for a thorough understanding of key concepts.

Step by step
Solved in 4 steps with 2 images

Recommended textbooks for you
Glencoe Algebra 1, Student Edition, 9780079039897…
Algebra
ISBN:
9780079039897
Author:
Carter
Publisher:
McGraw Hill

Holt Mcdougal Larson Pre-algebra: Student Edition…
Algebra
ISBN:
9780547587776
Author:
HOLT MCDOUGAL
Publisher:
HOLT MCDOUGAL
Glencoe Algebra 1, Student Edition, 9780079039897…
Algebra
ISBN:
9780079039897
Author:
Carter
Publisher:
McGraw Hill
Holt Mcdougal Larson Pre-algebra: Student Edition…
Algebra
ISBN:
9780547587776
Author:
HOLT MCDOUGAL
Publisher:
HOLT MCDOUGAL