Listed below are the numbers of years that archbishops and monarchs in a certain country lived after their election or coronation. Assume that the two samples are independent simple random samples selected from normally distributed populations. Do not assume that the population standard deviations are equal. Use a 0.10 significance level to test the claim that the mean longevity for archbishops is less than the mean for monarchs after coronation. All measurements are in years. E Click the icon to view the table of longevities of archbishops and monarchs.
Listed below are the numbers of years that archbishops and monarchs in a certain country lived after their election or coronation. Assume that the two samples are independent simple random samples selected from normally distributed populations. Do not assume that the population standard deviations are equal. Use a 0.10 significance level to test the claim that the mean longevity for archbishops is less than the mean for monarchs after coronation. All measurements are in years. E Click the icon to view the table of longevities of archbishops and monarchs.

Glencoe Algebra 1, Student Edition, 9780079039897, 0079039898, 2018
18th Edition
ISBN:9780079039897
Author:Carter
Publisher:Carter
Chapter10: Statistics
Section10.5: Comparing Sets Of Data
Problem 13PPS

Related questions

Question
8/
a. Test the claim that the contents of cans of diet soda have weights with a mean that is less than the mean for the regular soda.
What are the null and alternative hypotheses?
The test statistic, t,
The P-value is
State the conclusion for the test.
Fail to reject
the null hypothesis. There
is
sufficient evidence to support the claim that the cans of diet soda have mean weights that are lower than the mean weight for the regular soda.Reject
the null hypothesis. There
is not
sufficient evidence to support the claim that the cans of diet soda have mean weights that are lower than the mean weight for the regular soda.Fail to reject
the null hypothesis. There
is not
sufficient evidence to support the claim that the cans of diet soda have mean weights that are lower than the mean weight for the regular soda.Reject
the null hypothesis. There
is
sufficient evidence to support the claim that the cans of diet soda have mean weights that are lower than the mean weight for the regular soda.b. Construct a confidence interval appropriate for the hypothesis test in part (a).
Does the confidence interval support the conclusion found with the hypothesis test?
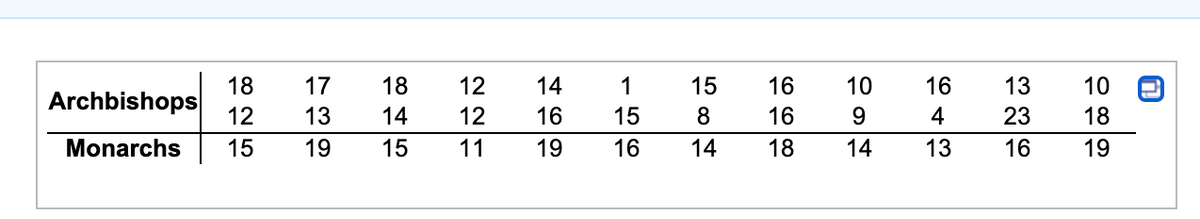
Transcribed Image Text:18
Archbishops
17
18
12
14
1
15
16
10
16
13
10
12
13
14
12
16
15
8
16
9.
4
23
18
Monarchs
15
19
15
11
19
16
14
18
14
13
16
19
Transcribed Image Text:Listed below are the numbers of years that archbishops and monarchs in a certain country lived after their election
or coronation. Assume that the two samples are independent simple random samples selected from normally
distributed populations. Do not assume that the population standard deviations are equal. Use a 0.10 significance
level to test the claim that the mean longevity for archbishops is less than the mean for monarchs after coronation.
All measurements are in years.
Click the icon to view the table of longevities of archbishops and monarchs.
Expert Solution
This question has been solved!
Explore an expertly crafted, step-by-step solution for a thorough understanding of key concepts.

This is a popular solution!

Trending now
This is a popular solution!

Step by step
Solved in 2 steps with 1 images

Knowledge Booster


Learn more about
Need a deep-dive on the concept behind this application? Look no further. Learn more about this topic, statistics and related others by exploring similar questions and additional content below.Recommended textbooks for you
Glencoe Algebra 1, Student Edition, 9780079039897…
Algebra
ISBN:
9780079039897
Author:
Carter
Publisher:
McGraw Hill
Glencoe Algebra 1, Student Edition, 9780079039897…
Algebra
ISBN:
9780079039897
Author:
Carter
Publisher:
McGraw Hill