Listed below are the overhead widths (in cm) of seals measured from photographs and the weights (in kg) of the seals. Construct a scatterplot, find the value of the linear correlation coefficient r, and find the critical values ofr using a =0.05. Is there sufficient evidence to conclude that there is a linear correlation between overhead widths of seals from photographs and the weights of the seals? Overhead Width Weight 7.1 7.7 114 181 9.9 9.2 8.7 8.1 179 249 196 200 Click here to view a table of critical values for the correlation coefficient. Construct a scatterplot. Choose the correct graph below. O B. Oc. c. OD. OD. Aweight (kg 300- Aweight (kg) 300 Aweight (kg) 300- Aweight (kg) 300 100 100 100 100 10 10 width (cm) width (cm) width (cm) width (om) The linear correlation coefficient is r= (Round to three decimal places as needed.)
Listed below are the overhead widths (in cm) of seals measured from photographs and the weights (in kg) of the seals. Construct a scatterplot, find the value of the linear correlation coefficient r, and find the critical values ofr using a =0.05. Is there sufficient evidence to conclude that there is a linear correlation between overhead widths of seals from photographs and the weights of the seals? Overhead Width Weight 7.1 7.7 114 181 9.9 9.2 8.7 8.1 179 249 196 200 Click here to view a table of critical values for the correlation coefficient. Construct a scatterplot. Choose the correct graph below. O B. Oc. c. OD. OD. Aweight (kg 300- Aweight (kg) 300 Aweight (kg) 300- Aweight (kg) 300 100 100 100 100 10 10 width (cm) width (cm) width (cm) width (om) The linear correlation coefficient is r= (Round to three decimal places as needed.)

Glencoe Algebra 1, Student Edition, 9780079039897, 0079039898, 2018
18th Edition
ISBN:9780079039897
Author:Carter
Publisher:Carter
Chapter4: Equations Of Linear Functions
Section4.5: Correlation And Causation
Problem 2BGP

Related questions
Question
100%
Transcribed Image Text:The critical values are r=
(Round to three decimal places as needed. Use a comma to separate answers as needed.)
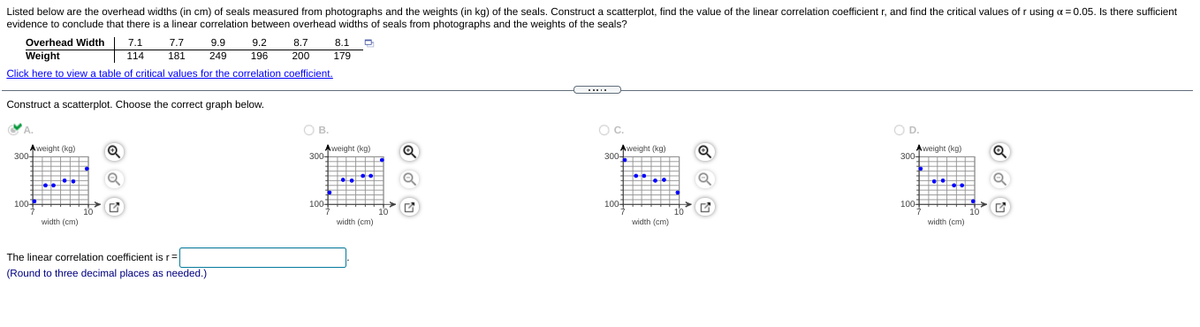
Transcribed Image Text:Listed below are the overhead widths (in cm) of seals measured from photographs and the weights (in kg) of the seals. Construct a scatterplot, find the value of the linear correlation coefficient r, and find the critical values of r using a= 0.05. Is there sufficient
evidence to conclude that there is a linear correlation between overhead widths of seals from photographs and the weights of the seals?
Overhead Width
7.1
7.7
9.9
9.2
8.7
8.1
Weight
249
179
114
181
196
200
Click here to view a table of critical values for the correlation coefficient.
Construct a scatterplot. Choose the correct graph below.
OB.
Oc.
OD.
Aweight (kg)
300-
Aweight (kg)
300-
Aweight (kg)
300-
Aweight (kg)
300-
nT"
---
--
.--- --
. ..
---
---
100
1001 ----
10
100-
100+
10
width (cm)
width (cm)
width (cm)
width (cm)
The linear correlation coefficient is r=
(Round to three decimal places as needed.)
Expert Solution
This question has been solved!
Explore an expertly crafted, step-by-step solution for a thorough understanding of key concepts.

This is a popular solution!

Trending now
This is a popular solution!

Step by step
Solved in 2 steps with 3 images

Recommended textbooks for you
Glencoe Algebra 1, Student Edition, 9780079039897…
Algebra
ISBN:
9780079039897
Author:
Carter
Publisher:
McGraw Hill

Big Ideas Math A Bridge To Success Algebra 1: Stu…
Algebra
ISBN:
9781680331141
Author:
HOUGHTON MIFFLIN HARCOURT
Publisher:
Houghton Mifflin Harcourt
Glencoe Algebra 1, Student Edition, 9780079039897…
Algebra
ISBN:
9780079039897
Author:
Carter
Publisher:
McGraw Hill
Big Ideas Math A Bridge To Success Algebra 1: Stu…
Algebra
ISBN:
9781680331141
Author:
HOUGHTON MIFFLIN HARCOURT
Publisher:
Houghton Mifflin Harcourt