lities for both companies. Which company do you think is in a better position? Compare the general trends of noncurrent liabilities for both
lities for both companies. Which company do you think is in a better position? Compare the general trends of noncurrent liabilities for both

Auditing: A Risk Based-Approach (MindTap Course List)
11th Edition
ISBN:9781337619455
Author:Karla M Johnstone, Audrey A. Gramling, Larry E. Rittenberg
Publisher:Karla M Johnstone, Audrey A. Gramling, Larry E. Rittenberg
Chapter5: Professional Auditing Standards And The Audit Opinion Formulation Process
Section: Chapter Questions
Problem 9RQSC: Assume that an organization asserts that it has $35 million in net accounts receivable. Describe...

Related questions
Question
100%
- Compare the general trends of current liabilities for both companies. Which company do you think is in a better position?
- Compare the general trends of noncurrent liabilities for both companies. Which company do you think is in a better position?
- Compare the general trends of equity for both companies. Which company do you think is in a better position?
- Which company fared better using the horizontal analysis?
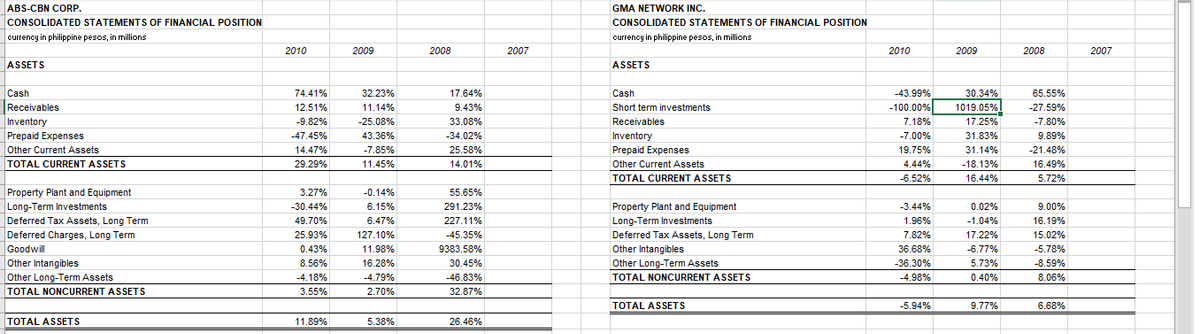
Transcribed Image Text:ABS-CBN CORP.
GMA NETWORK INC.
CONSOLIDATED STATEMENTS OF FINANCIAL POSITION
CONSOLIDATED STATEMENTS OF FINANCIAL POSITION
currency in philippine pesos, in millions
currency in philippine pesos, in millions
2010
2009
2008
2007
2010
2009
2008
2007
ASSETS
ASSETS
Cash
74.41%
32.23%
17.64%
Cash
-43.99%
30.34%
65.55%
Receivables
12.51%
11.14%
9.43%
Short term investments
-100.00%
1019.05%
-27.59%
33.08%
-7.80%
Inventory
Prepaid Expenses
-9.82%
-25.08%
Receivables
7.18%
17.25%
-47.45%
43.36%
-34.02%
Inventory
Prepaid Expenses
-7.00%
31.83%
9.89%
Other Current Assets
14.47%
-7.85%
25.58%
19.75%
31.14%
-21.48%
TOTAL CURRENT ASSETS
29.29%
11 45%
14.01%
Other Current Assets
4.44%
-18.13%
16.49%
TOTAL CURRENT ASSETS
-6.52%
16.44%
5.72%
Property Plant and Equipment
Long-Term Investments
3.27%
-0.14%
55.65%
-30.44%
6.15%
291.23%
Property Plant and Equipment
-3.44%
0.02%
9.00%
Deferred Tax Assets, Long Term
49.70%
6.47%
227.11%
Long-Term Investments
1.96%
-1.04%
16.19%
Deferred Charges, Long Term
25.93%
127.10%
45.35%
Deferred Tax Assets, Long Term
7.82%
17.22%
15.02%
Goodwill
Other Intangibles
0.43%
11.98%
9383.58%
Other Intangibles
36.68%
-6.77%
-5.78%
8.56%
16.28%
30.45%
Other Long-Term Assets
-36.30%
5.73%
-8.59%
Other Long-Term Assets
-4.18%
-4.79%
-46.83%
TOTAL NONCURRENT ASSETS
-4.98%
0.40%
8.06%
TOTAL NONCURRENT ASSETS
3.55%
2.70%
32.87%
TOTAL ASSETS
-5.94%
9.77%
6.68%
TOTAL ASSETS
11.89%
5.38%
26.46%
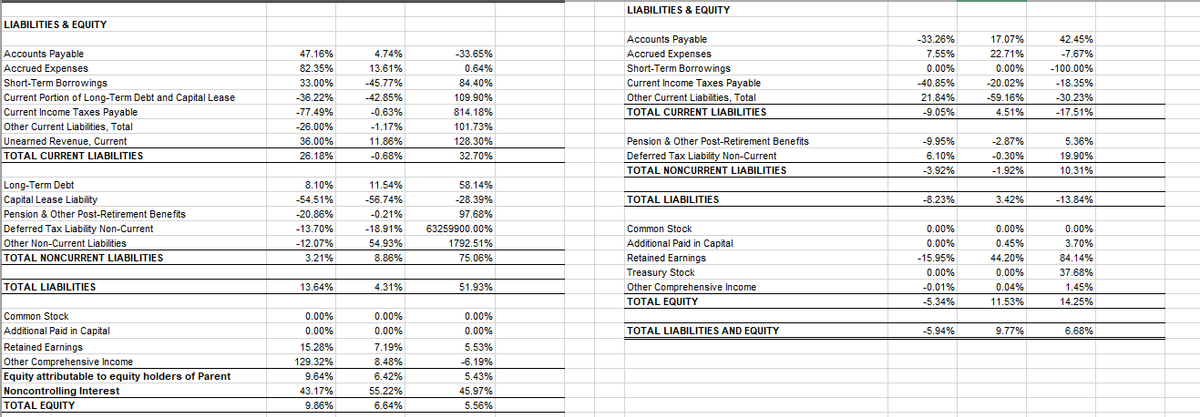
Transcribed Image Text:LIABILITIES & EQUITY
LIABILITIES & EQUITY
Accounts Payable
-33.26%
17.07%
42.45%
Accounts Payable
Accrued Expenses
Short-Term Borrowings
47.16%
4.74%
-33.65%
Accrued Expenses
7.55%
22.71%
-7.67%
82.35%
13.61%
0.64%
Short-Term Borrowings
0.00%
0.00%
-100.00%
33.00%
-45.77%
84.40%
Current Income Taxes Payable
-40.85%
-20.02%
-18.35%
Other Current Liabilities, Total
-59,16%
Current Portion of Long-Term Debt and Capital Lease
Current Income Taxes Payable
-36.22%
-42.85%
109.90%
21.84%
-30.23%
-77.49%
-0.63%
814.18%
TOTAL CURRENT LIABILITIES
-9.05%
4.51%
-17.51%
Other Current Liabilities, Total
-26.00%
-1.17%
101.73%
Unearned Revenue, Current
11. 25%
11.86%
Pension & Other Post-Retirement Benefits
36.00%
128.30%
-9.95%
-2.87%
5.36%
TOTAL CURRENT LIABILITIES
26.18%
-0.68%
32.70%
Deferred Tax Liability Non-Current
6.10%
-0.30%
19.90%
TOTAL NONCURRENT LIABILITIES
-3.92%
-1.92%
10.31%
Long-Term Debt
Capital Lease Liability
8.10%
11.54%
58.14%
-54.51%
-56.74%
-28.39%
TOTAL LIABILITIES
-8.23%
3.42%
-13.84%
Pension & Other Post-Retirement Benefits
-20.86%
-0.21%
97.68%
Deferred Tax Liability Non-Current
-13.70%
-18.91%
63259900.00%
Common Stock
0.00%
0.00%
0.00%
Other Non-Current Liabilities
Additional Paid in Capital
Retained Earnings
-12.07%
54.93%
1792.51%
0.00%
0.45%
3.70%
TOTAL NONCURRENT LIABILITIES
3.21%
8.86%
75.06%
-15.95%
44.20%
84.14%
Treasury Stock
0.00%
0.00%
37.68%
TOTAL LIABILITIES
13.64%
4.31%
51.93%
Other Comprehensive Income
TOTAL EQUITY
-0.01%
0.04%
1.45%
-5.34%
11.53%
14.25%
Common Stock
0.00%
0.00%
0.00%
Additional Paid in Capital
Retained Earnings
Other Comprehensive Income
0.00%
0.00%
0.00%
TOTAL LIABILITIES AND EQUITY
-5.94%
9.77%
6.68%
15.28%
7.19%
5.53%
129.32%
8.48%
-6.19%
6.42%
Equity attributable to equity holders of Parent
Noncontrolling Interest
9.64%
5.43%
43.17%
55.22%
45.97%
TOTAL EQUITY
9.86%
6.64%
5.56%
Expert Solution
This question has been solved!
Explore an expertly crafted, step-by-step solution for a thorough understanding of key concepts.

Step by step
Solved in 2 steps

Knowledge Booster


Learn more about
Need a deep-dive on the concept behind this application? Look no further. Learn more about this topic, accounting and related others by exploring similar questions and additional content below.Recommended textbooks for you
Auditing: A Risk Based-Approach (MindTap Course L…
Accounting
ISBN:
9781337619455
Author:
Karla M Johnstone, Audrey A. Gramling, Larry E. Rittenberg
Publisher:
Cengage Learning
Auditing: A Risk Based-Approach (MindTap Course L…
Accounting
ISBN:
9781337619455
Author:
Karla M Johnstone, Audrey A. Gramling, Larry E. Rittenberg
Publisher:
Cengage Learning