llowing is a portion of the regression output for an application relating maintenance expense (dollars per month) to usage (hours per week) for a particular brand of computer terminal.
llowing is a portion of the regression output for an application relating maintenance expense (dollars per month) to usage (hours per week) for a particular brand of computer terminal.

College Algebra
7th Edition
ISBN:9781305115545
Author:James Stewart, Lothar Redlin, Saleem Watson
Publisher:James Stewart, Lothar Redlin, Saleem Watson
Chapter1: Equations And Graphs
Section: Chapter Questions
Problem 10T: Olympic Pole Vault The graph in Figure 7 indicates that in recent years the winning Olympic men’s...

Related questions
Question
Following is a portion of the regression output for an application relating maintenance expense (dollars per month) to usage (hours per week) for a particular brand of computer terminal.
question 12 attached in ss below
thanks for elp
appreiacted
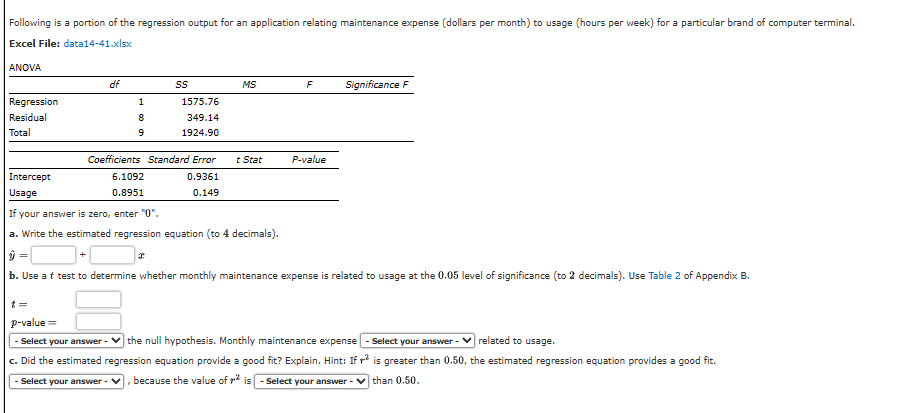
Transcribed Image Text:Following is a portion of the regression output for an application relating maintenance expense (dollars per month) to usage (hours per week) for a particular brand of computer terminal.
Excel File: data14-41.xlsx
ANOVA
Regression
Residual
Total
Intercept
Usage
df
1
8
9
6.1092
0.8951
SS
Coefficients Standard Error
0.9361
0.149
1575.76
349.14
1924.90
I
MS
t Stat
F
P-value
Significance F
If your answer is zero, enter "0".
a. Write the estimated regression equation (to 4 decimals).
ŷ =
b. Use a t test to determine whether monthly maintenance expense is related to usage at the 0.05 level of significance (to 2 decimals). Use Table 2 of Appendix B.
t=
p-value=
- Select your answer - the null hypothesis. Monthly maintenance expense - Select your answer -
c. Did the estimated regression equation provide a good fit? Explain. Hint: If
- Select your answer - V because the value of is-Select your answer
related to usage.
is greater than 0.50, the estimated regression equation provides a good fit.
than 0.50.
Expert Solution
This question has been solved!
Explore an expertly crafted, step-by-step solution for a thorough understanding of key concepts.

This is a popular solution!

Trending now
This is a popular solution!

Step by step
Solved in 3 steps

Recommended textbooks for you
College Algebra
Algebra
ISBN:
9781305115545
Author:
James Stewart, Lothar Redlin, Saleem Watson
Publisher:
Cengage Learning

Algebra and Trigonometry (MindTap Course List)
Algebra
ISBN:
9781305071742
Author:
James Stewart, Lothar Redlin, Saleem Watson
Publisher:
Cengage Learning

Linear Algebra: A Modern Introduction
Algebra
ISBN:
9781285463247
Author:
David Poole
Publisher:
Cengage Learning
College Algebra
Algebra
ISBN:
9781305115545
Author:
James Stewart, Lothar Redlin, Saleem Watson
Publisher:
Cengage Learning
Algebra and Trigonometry (MindTap Course List)
Algebra
ISBN:
9781305071742
Author:
James Stewart, Lothar Redlin, Saleem Watson
Publisher:
Cengage Learning
Linear Algebra: A Modern Introduction
Algebra
ISBN:
9781285463247
Author:
David Poole
Publisher:
Cengage Learning

Glencoe Algebra 1, Student Edition, 9780079039897…
Algebra
ISBN:
9780079039897
Author:
Carter
Publisher:
McGraw Hill

Functions and Change: A Modeling Approach to Coll…
Algebra
ISBN:
9781337111348
Author:
Bruce Crauder, Benny Evans, Alan Noell
Publisher:
Cengage Learning