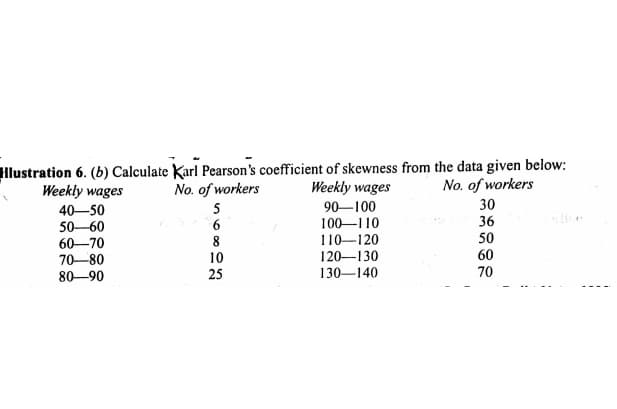
llustration 6. (b) Calculate Karl Pearson's coefficient of skewness from the data given below: Weekly wages No. of workers Weekly wages No. of workers 30 36 90-100 100-110 110-120 120-130 130-140 40-50 50-60 5 6. 60-70 70-80 8 10 50 60 70 80-90 25


Q: a. Using Excel, develop the multiple regression equation for these data. b. What is the coefficient ...
A: According to the answering guidelines, we can answer only three subparts of a question and the rest ...
Q: https://ng.cengage.com/static/nb/ui/evo/index.html?deploymentld%3D5996521842592485862331 E Module 3 ...
A:
Q: Given observations r1,..., an u and o?, derive the formula for #(ur1,..., xn), the marginal posterio...
A: @solution:: thank you for asking this question . here you are answer .
Q: Deviation of two series X and Y from an assumed average are shown below. Calculate coefficient of co...
A:
Q: (a) Find the least-squares regression line treating the number of absences, x, as the explanatory va...
A: Given: x y 0 88.5 1 85.6 2 82.7 3 80.2 4 77.2 5 72.8 6 63.1 7 67.7 8 64.9 9 ...
Q: Chapter 06, Section 6.4, Problem 043 A study has shown that 23% of all college textbooks have a pric...
A:
Q: Suppose that the amount of time that students spend studying in the library in one sitting is normal...
A: Given,sample size(n)=46mean(μ)=48standard deviation(σ)=17
Q: Mary is playing a game where she flips a coin with probability of head = p. She wins $1 if the coins...
A: Below the handwritten solution.
Q: 1a) Write 17 x 16 x 15 x 14 x 13 x 12 x 11 x 10 x 9 x 8 in the form „P. 1b) Express 21C, as a sum of...
A: Here AS PER POLICY I HAVE CALCULATED 3 SUBPARTS PLZ REPOST FOR REMAINING PARTS HERE USE COMBINATION...
Q: Determine whether literacy and employment are associated or not.
A: We will calculate the Yule's coefficient of association to determine whether literacy and employment...
Q: a. P (at most 3) b. P (one or more) C. mean u
A: Given: X has Hypergeometric distribution with N=15, n=4, k=5
Q: The Green party of Canada is planning on conducting a survey to estimate the proportion of Canadians...
A:
Q: A pharmaceutical company wants to estimate the mean life of a particular drug under typical weather ...
A:
Q: Examine the effect of gender on annual salary, controlling for age and experience factors using the ...
A: Given information: Employee Number Annual Salary Gender Gender dummy Age (Years) Experience (Year...
Q: For a frequency distribution of marks in Statistics for 100 students, the arithmetic average was fou...
A:
Q: A Gallup poll asked a sample of Canadian adults if they thought the law should allow doctors to end ...
A: Givensample size(n)=260x=163p^=xn=163260=0.6269
Q: What is the expected value of X
A: Let p be the proportion of cars which are red. It is given that p = 0.05 And X = the number of cars...
Q: b) All Things Bright, a light manufacturing company makes a light bulb whose life, X, in hours, foll...
A:
Q: Example 16. q =b-!. Show that if T = ae4, then Marginal cost is equakto Average cost provided
A:
Q: This dataset of size n - 51 is for the 50 states and the District of Columhia in the United States. ...
A: According to the answering guidelines, we can answer only three subparts of a question and the rest ...
Q: Suppose a new production method will be implemented if a hypothesis test supports the conclusion tha...
A: Given Information: The mean operating cost per hour for the current production method is $225. Claim...
Q: a. Using Excel, develop a multiple regression equation for these data. b. What is the coefficient of...
A: Hello! As you have posted more than 3 sub parts, we are answering the first 3 sub-parts. In case yo...
Q: Employee Number Annual Salary Gender Gender dummy Age (Years) Experience (Years) Training Level Trai...
A: Given information: Employee Number Annual Salary Gender Gender dummy Age (Years) Experience (Year...
Q: (d) Which countries are outliers? Select the outlier(s). Select "There are no outliers.", if applica...
A: Given data is2,1,7,2,2,19,18,6,4,9,4,20,1,2,1,3,2,33,4,2,23,10,15,100Arrange the data in ascending o...
Q: Question 4-6. Results of a retrospective case control study of a chronic disease and exposure to a p...
A:
Q: if power is 90%, this implies that you have: -a 90% chance of making a type 1 error - a 90% chance o...
A: Type I error: The type I error if the null hypothesis is rejected when it is actually true.
Q: Central Limit Theorem for Sums Suppose random samples of n = 37 are collected from an unknown distri...
A:
Q: In a previous election, the confidence interval for the proportion of likely voters who would vote f...
A: given;confidence interval for the proportion;(0.4401, 0.5199)i.e. (p^-E, p^+E)where p^ : point esti...
Q: What happened to mean of the ratio between
A: @solution::: 1) Proportion of Means: it ascertains the proportion between the amount of defaults o...
Q: 4 Example 4. The average cost for a commodity is given by AC = x + 4 +-. Find the total and marginal...
A:
Q: RS Suppose X1,.. , Xn N(4, o2), o²: known, O = {40, H1}. (Orl >)Irl = rl: 'H sa Ort = 1l : 0H Find a...
A:
Q: Analyse the frequency distribution by the method of moments: X: 2 3 4 5 6 f. 1 3 7 3
A:
Q: Lesson 13 Q10 P(0 < Z< 1.06) = A.1.06 B.1 C.0.3554 D.0.1446
A:
Q: Solve for P(X=0,Y=0).
A: Here given, 2 balls are randomly selected from an urn containing 3 red, 4 blue, and 5 white balls....
Q: Exercise 08.02 Algo (Population Mean: Sigma Known) A simple random sample of 60 items from a populat...
A: Given information sample size n=60 Sample mean x=31 Population SD σ=9
Q: o estimate the mean score ?μ of those who took the Medical College Admission Test on your campus, yo...
A: Solution: Given information. σ=6.6 Population standard deviation. 99.7% of the all samples give an...
Q: The credit card payment, PaymentAmt, made last month by 100 credit card holders was obtained and pro...
A: It is given that the credit card payment follows a distribution with mean 163.76 and standard deviat...
Q: What is the minimum head breadth that will fit the clientele? min = What is the maximum head breadth...
A: Engineers must consider the breadths of male heads when designing helmets. The company researchers h...
Q: How do you find the mean and variance of part(d)?I need the detailed solution.
A:
Q: State the Five Number Summary for the following dataset. 44 45 46 47 49 51 54 55 58...
A:
Q: Draw the two ogives for thhe following distribution showing the number of marks of 59 students : Mar...
A: Given : Total frequency (N) =59 Marks No. of students 0-10 4 Oct-20 8 20-30 11 30-40 15 ...
Q: Example 6. If the cost of making x units is C Rupees where c = 10 + 9x of units with marginal cost b...
A:
Q: answer c & d only
A: Given X~Nμ1,σ12 with sample size nY~Nμ2,σ22 with sample size m
Q: Find the standard deviation, s, of sample data summarized in the frequency distribution table given ...
A: Concentration of all the values around the central value of the given data is known as measures of c...
Q: Estimate 95% confidence interval for the proportion of household experiencing burglary in 2010."
A: 25.8 households per 1,000 were the victims of home burglary. These data are obtained from a survey o...
Q: C. If each pair of die is "loaded" so that one comes up half as often as it should, six. .come up ha...
A:
Q: * (a) The simple correlation coefficients between temperature (X1), corn yield (X2) and 'rainfall (X...
A:
Q: The average time to run the 5K fun run is 21 minutes and the standard deviation is 2.7 minutes. 10 r...
A: As per guidelines expert have to answer first question only dear student please upload other questio...
Q: The money raised and spent (both in millions of dollars) by all congressional campaigns for 8 recent...
A: The coefficient of determination is the percentage of variation in y explained by the variable x. Co...
Q: For many people, breakfast cereal is an important source of fiber in their diets. Cereals also cont...
A: Given Potassium=39+28 fiber Fiber=9

Step by step
Solved in 3 steps with 3 images

- Altmans z-score Altmans z-score is a financial tool for predicting insolvency in a business. For a certain company, the z-score formula is z=0.84+0.6StockpriceOutstandingsharesTotalliabilty In this exercise, we assume that thre are 45, 000 outstanding shares at a price of 4.80 each. a. Use L, for total liability, in dollard, and give a formula for the z-score for this company. b. Would a larger total liability idicate a better or worese outlook for the company? c. A z-score of 1.81 or lower indicates a high probability of insolvency. What is the smallest value of L that will give a z-score that indicates a high probability on insolvency?1. Calculate Karl Pearson’s coefficient of skewness:Variable Frequency Variable Frequency70-80 11 30-40 2160-70 22 20-30 1150-60 30 10-20 640-50 35 0 -10 5Qestion 1- from table below: x y x2 y2 xy5 25 25 625 1253 20 9 400 604 21 16 441 8410 35 100 225 35015 38 225 1444 570∑X= ∑y= ∑X2= ∑y2= ∑XY=Correlation Coefficient is: A-0.79B-0.97C-0.03D-1 Coefficient of Determination is: A-0.97B-0.0C-0.94D-0.06 The Coefficient of Determination quantity means: A-94% from data can be explained from the linear equation between x and yB-94% from data can not be explained from the linear equation between x and yC97% from data can be explained from the linear equation between x and yD-6% from data can be explained from the linear equation between x and y The relation between x and whey is: A-perfect directB-strong indirectC-intermediate directD-strong direct The Coefficient of Determination quantity from: A(-1 to 1)B(-1 to 0)C(0 to -1)D(0 to 1)
- NEW STUDY: Dr. Apnea conducted a study investigating the effects of sleep deprivation on complex problem solving. He gave 25 college students a problem-solving test at noon on one day and a second problem-solving test at noon the following day. He found that there was a statistically significant mean decrease of 4.7 between the two tests from the first day to the second day. The test yielded a Cohen’s d = .82. Which of the following statements is an accurate interpretation of Dr. Apnea’s research? Group of answer choices It doesn’t matter how much sleep you get, some people just aren’t good at problem solving. If you don’t get enough sleep your problem solving abilities suffer, but only with a small absolute magnitude. If you don’t get enough sleep your problem solving abilities suffer with a medium absolute magnitude. If you don’t get enough sleep your problem solving abilities suffer with a large absolute magnitude.INV 2-3c Suppose that the index model for two Canadian stocks HD and ML is estimated with the following results: RHD =0.02+0.80RM+eHD R-squared =0.6 RML =-0.03+1.50RM+eML R-squared =0.4 σM =0.20 where M is S&P/TSX Comp Index and RX is the excess return of stock X. c. What is the covariance and the correlation coefficient between HD and ML?Consider the Categorical Variable County Classification with the following categories : Urban , Suburban Exurban , and Rural . The dependent variable in the Linear Regression is the percentage of the population under 18 years of age in decimal form . Suppose Urban is the excluded category . The coefficient on Suburban is 0.07 . The coefficient on Exurban is -0.002 . The coefficient on Rural is -0.12. What is the interpretation of the coefficient on Suburban ? A. Suburban counties have a 7 percentage point higher population under 18 years of age compared to Urban counties B. Suburban counties have a 7 percentage point higher population under 18 years of age compared to Rural counties C. Urban counties have a 7 percentage point higher population under 18 years of age compared to Suburban counties D. There no way to determine from these results how the percentage of the population under 18 years of age is different in different county classifications
- A regression was run to determine if there is a relationship between the happiness index (y) and life expectancy in years of a given country (x).The results of the regression were: ˆyy^=a+bxa=-1.778b=0.143 (a) Write the equation of the Least Squares Regression line of the formˆyy^= + x(b) Which is a possible value for the correlation coefficient, rr? -0.853 0.853 -1.931 1.931 (c) If a country increases its life expectancy, the happiness index will decrease increaseA “Cobb–Douglas” production function relates production (Q) to factorsof production, capital (K), labor (L), and raw materials (M), and an errorterm u using the equation Q = λKβ1Lβ2Mβ3eu, where λ, β1, β2, and β3 areproduction parameters. Suppose that you have data on production and thefactors of production from a random sample of firms with the same Cobb–Douglas production function. How would you use regression analysis toestimate the production parameters?Marine biologists have noticed that the color of the outermost growth band on a clam tends to be related to the time of year in which the clam dies. A biologist conducted a small investigation of whether this is true for the species Protothaca staminea. She collected a sample of 50 clam shells in February and 27 clam shells in March. 15 of the shells from February had a dark color on the outermost growth band, whereas 8 of the shells from March had a dark color on the outermost growth band. Carry out a hypothesis test to see if there is a difference in the proportion of shells with a dark outermost growth band between the two months. The point estimate for the true difference in proportion of dark growth bands between February and March is:
- Marine biologists have noticed that the color of the outermost growth band on a clam tends to be related to the time of year in which the clam dies. A biologist conducted a small investigation of whether this is true for the species Protothaca staminea. She collected a sample of 50 clam shells in February and 27 clam shells in March. 15 of the shells from February had a dark color on the outermost growth band, whereas 8 of the shells from March had a dark color on the outermost growth band. Carry out a hypothesis test to see if there is a difference in the proportion of shells with a dark outermost growth band between the two months. Let ? = 0.01. A) The point estimate for the true difference in proportion of dark growth bands between February and March is:Marine biologists have noticed that the color of the outermost growth band on a clam tends to be related to the time of year in which the clam dies. A biologist conducted a small investigation of whether this is true for the species Protothaca staminea. She collected a sample of 50 clam shells in February and 27 clam shells in March. 15 of the shells from February had a dark color on the outermost growth band, whereas 8 of the shells from March had a dark color on the outermost growth band. Carry out a hypothesis test to see if there is a difference in the proportion of shells with a dark outermost growth band between the two months. Let ? = 0.01.Note: Do all calculations as February - March A) The point estimate for the true difference in proportion of dark growth bands between February and March is: I need help and webassign rejected the 0.0037 as the answer. I'm so lost. I emailed my professor and he hasn't gotten back to me. Please help. Thank you.x 0 2 2 4 5 y -1 0 4 6 7 calculate: sum of the xy values, sum of xsquared values, sum of the y squared values and value of r, the correlation coefficient


