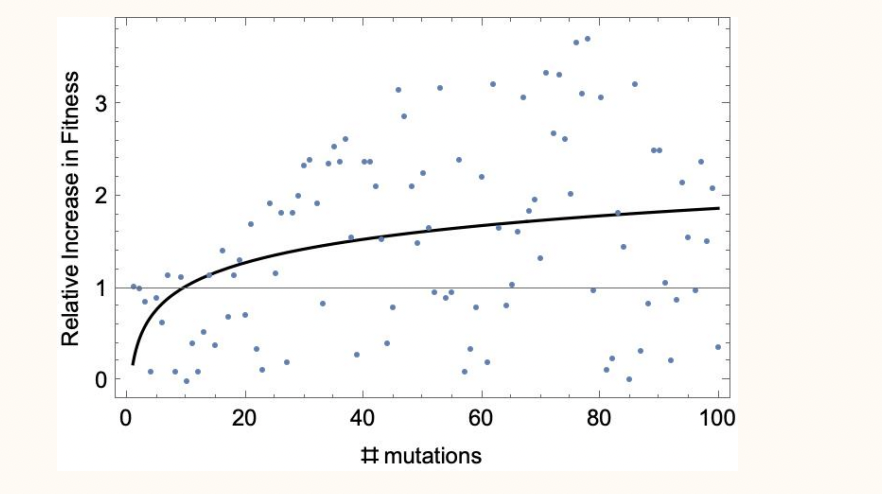
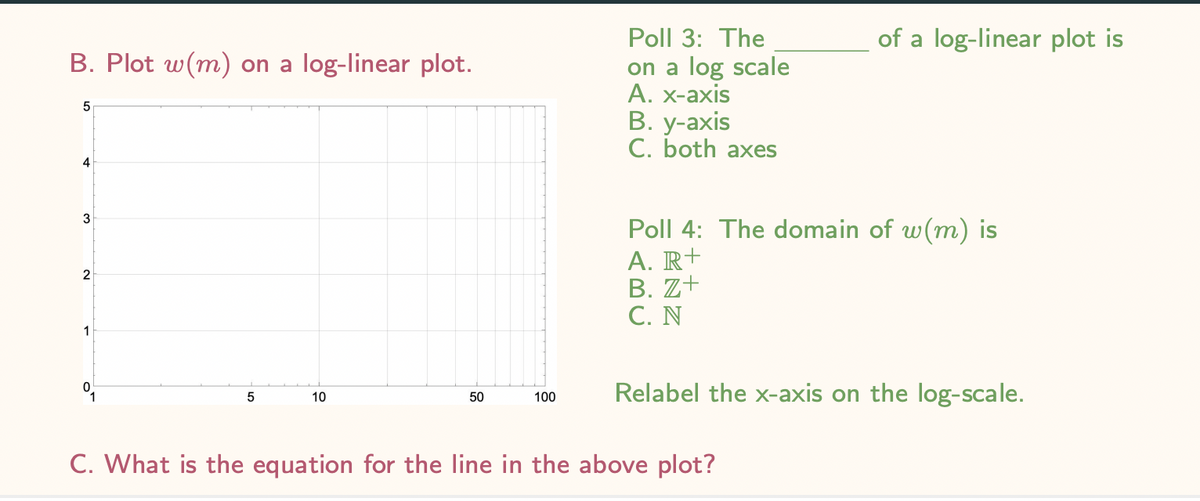
Logarithm functions are one way of expressing diminishing returns. Many biological phenomena exhibit this property where increased ‘effort’ x-axis becomes less and less efficient at increasing ‘output’ y-axes. For example, consider a population of the green algae Chlamydomonas collected from a pond adapting to the conditions of a laboratory. Each new mutation that increases the evolutionary fitness of the algae to the lab has a smaller effect than the previous one. In other words, as the population becomes more and more well adapted its harder and harder to increase fitness. This form of diminishing returns is shown in the plot in the first image attached. w(m) = 0.178 + 0.846 log(m) m = # mutations w = rel. fitness See the 2nd attached image for the two green poll questions that need to be answered please!
Glencoe Algebra 1, Student Edition, 9780079039897, 0079039898, 2018
18th Edition
ISBN:9780079039897
Author:Carter
Publisher:Carter
Chapter10: Statistics
Section10.2: Representing Data
Problem 4GP
icon
Related questions
Question

Logarithm functions are one way of expressing diminishing returns. Many biological phenomena exhibit this property where increased ‘effort’ x-axis becomes less and less efficient at increasing ‘output’ y-axes. For example, consider a population of the green algae Chlamydomonas collected from a pond adapting to the conditions of a laboratory. Each new mutation that increases the evolutionary fitness of the algae to the lab has a smaller effect than the previous one. In other words, as the population becomes more and more well adapted its harder and harder to increase fitness. This form of diminishing returns is shown in the plot in the first image attached.

w(m) = 0.178 + 0.846 log(m)

m = # mutations w = rel. fitness

See the 2nd attached image for the two green poll questions that need to be answered please!
Relative Increase in Fitness
3
2
0
0
20
40
60
#mutations
80
100
Transcribed Image Text:Relative Increase in Fitness 3 2 0 0 20 40 60 #mutations 80 100
B. Plot w(m) on a log-linear plot.
5
4
3
2
1
5
10
50
100
Poll 3: The
on a log scale
A. x-axis
B. y-axis
C. both axes
of a log-linear plot is
Poll 4: The domain of w(m) is
A. R+
B. Z+
C. N
Relabel the x-axis on the log-scale.
C. What is the equation for the line in the above plot?
Transcribed Image Text:B. Plot w(m) on a log-linear plot. 5 4 3 2 1 5 10 50 100 Poll 3: The on a log scale A. x-axis B. y-axis C. both axes of a log-linear plot is Poll 4: The domain of w(m) is A. R+ B. Z+ C. N Relabel the x-axis on the log-scale. C. What is the equation for the line in the above plot?
Expert Solution
steps

Step by step

Solved in 2 steps with 2 images

Blurred answer
Recommended textbooks for you
Glencoe Algebra 1, Student Edition, 9780079039897…
Algebra
ISBN:
9780079039897
Author:
Carter
Publisher:
McGraw Hill
College Algebra
College Algebra
Algebra
ISBN:
9781938168383
Author:
Jay Abramson
Publisher:
OpenStax
Big Ideas Math A Bridge To Success Algebra 1: Stu…
Algebra
ISBN:
9781680331141
Author:
HOUGHTON MIFFLIN HARCOURT
Publisher:
Houghton Mifflin Harcourt
Intermediate Algebra
Algebra
ISBN:
9781285195728
Author:
Jerome E. Kaufmann, Karen L. Schwitters
Publisher:
Cengage Learning
Algebra and Trigonometry (MindTap Course List)
Algebra
ISBN:
9781305071742
Author:
James Stewart, Lothar Redlin, Saleem Watson
Publisher:
Cengage Learning
College Algebra (MindTap Course List)
Algebra
ISBN:
9781305652231
Author:
R. David Gustafson, Jeff Hughes
Publisher:
Cengage Learning