Look for the following: Mean, Median, Mode, Variance Standard Deviation, and z-score. Class Frequency 61-65 3 56-60 51-55 46-50 10 41-45 12 36-40 11 31-35 15 26-30 14 21-25 4 Age Doesn' t Matter Variance: standard Deviation: z-score:
Q: Which of the following could we find by examining a boxplot for a set of data?: I. mean II. median…
A: Given that, Which of the following could we find by examining a boxplot for a set of data?
Q: B- For data mentioned below, find mean, median, variance, Range, standare deviation, First, second…
A: Data, in ascending order,1,2,3,5,7,8,9,11,13,14,15,16,17,18,19,20,21,22,24,25,26n=0
Q: Calculate the mean deviation from the mean for the following data : Size : 2 6 8 10 12 14 16 ency :…
A: We have given that data Mean = sum of all observations/total number of observations.
Q: Look for the following: Mean, Median, Mode, Variance, Standard Deviation, and z-score. Class…
A: We have given a grouped data table consisting class intervel and frequency, We have to find out,…
Q: 4. The following are the number of hours travelled by a senior high school student to go to school…
A: Given that XX X^2X2 .5 0.25 .25 0.0625 1.4 1.96 1.5 2.25 .85 0.7225 .20 0.04 1.5…
Q: Calculate the standard deviation and variance of the sample quantitative data shown, to two decimal…
A:
Q: A Student Gender Hours online/week Friends 1 male 2 female 50 L30 3 female 4 female 70 2.
A: Given: The data given is as below Hours online/week Friends 4 90 2 50 2 30 5 70 5 70…
Q: Suppose a mathematics class with 30 students is given an examination and the raw scores are shown…
A: Note, Since you have posted a question with multiple sub-parts, we will solve first three sub-parts…
Q: weekly sales number of sellers 30- 35 2 35- 40 40- 45 10 18 45- 50 50 50- 55 70 55E 60 30 60E 65 65-…
A: Note :-“Since you have posted a question with multiple sub-parts, we will solve first three subparts…
Q: Imagine that you and four of your classmates have measured the density of air and recorded the…
A: Let X be an density of air kg/m3. Therefore, X=1.27,1.21,1.28,1.25,1.24 We have to find average,…
Q: The following data represents the age distribution of a sample of 100 people covered by Health…
A: Note: Hey there! Thank you for the question. As you have posted a question with multiple sub-parts,…
Q: Which of the following is the best measure of dispersion for a skewed distribution? O Variance O…
A: Solution-: Which of the following is the best measure of dispersion for a skewed distribution? (a)…
Q: Here is a sample of scores: 6, 8, 5, 1, 3, 7, 7, 10, 9, 4 A) What is the variance? B) What is…
A:
Q: Value | Frequency 27 96 58 3 54 4 18 7
A:
Q: Match the histograms on the right to the summary statistics given. Standard Mean Median Deviation 60…
A:
Q: Calculate Median, Q1, Q3 and IQR, sample mean, sample variance, and sample standard deviation for…
A: Given: data 48, 92, 47, 44, 94, 18, 95, 67, 74, 64
Q: The math grades of the 40 students in a class are given by the table X₁ 2 3 4 5 6 7 8 9 F₁ 1 3 5 6 9…
A: Solution-: Given data: xi 1 2 3 4 5 6 7 8 9 10 fi 1 1 3 5 6 9 8 2 3 2 We want to find (a)…
Q: Calculate the standard deviation and variance of the data shown, to two decimal places 20.7 28.5…
A:
Q: In a study, temperature readings were taken at different locations in 1979 and in 1996. The average…
A: The random variable daily temperature is normally distributed. There are two samples which are 1979…
Q: Which of the following is NOT a measure of the spread or dispersion of a set of data? a Standard…
A: The measure of dipersion is a measure that measures whether the data is uniformly distributed or…
Q: Which of the following is not a measure of dispersion in a set of data? O standard deviation O…
A: Remark: A measure of dispersion for a data set helps us to know about the spread of the data set.
Q: 1b) Calculate the mean deviation from the mean for the following data: Size : 4 8. 10 12 14 16…
A: We have given that, Date set in the form of size and frequency is, Xi = 2 4 6 8 10…
Q: Calculate mean deviation from (i) mean and (ii) Median for the following data. Also calculate…
A: Mean deviation are easily calculated and it involve all the observations in the data set. But it is…
Q: Which of the following does NOT reveal the variation (spread) of the data? Check all that apply.…
A: A measure of central tendency helps to identify the location of a dataset, whereas a measure of…
Q: 13New July 14, 2020. Which of the following is good measure of central value for large number of…
A:
Q: The ages (in years) of a random sample of shoppers at a gaming store are shown. Determine the range,…
A: We have to calculate some summary statistics for given data.
Q: 4. For the following data, find the sample variance and sample standard deviation: -6, 6, 6, 0, -6,…
A:
Q: Determine the Mean, Range, Mean Deviation, Sample Variance, Sample Standard Deviation and…
A:
Q: The Highway Patrol, using radar, checked the speeds (in mph) of 30 passing motorists at a…
A:
Q: 1. For the following sets of data, find the mean, variance, and standard deviation: 2 6 8 8 8 8 11…
A:
Q: We are going to calculate the standard deviation for the following set of sample data. 8 15 11 6. 3…
A: Given data, 8,5,11,9,3 standard deviation=?
Q: The following are the number of cars passing a point on a highway per minute. 10 12 11 19 21…
A: Given raw data for for passing of cars : We have to calculate mean, median, mode, standard deviation…
Q: Find Mean, Median, Mode, sample variance and range for following set of data: 0.23 0.36 0.56 0.89…
A: The mean can be calculated as: The data can be arranged in ascending order as: 0.23, 0.36, 0.56,…
Q: 4. Calculate the variance and standard deviation for the students score data. Score 10-14 15-19…
A: (4) Obtain the value of the standard deviation for the students score data. The value of the…
Q: Which of the following is a biased estimator? That is, which of the following does not target the…
A: If a sample represents the population from which it is taken, then, the population parameters are…
Q: What statistic is appropriate for describing the center of the data on the histogram above? 1. Мean…
A: We know that ; There are three measure of central tendency: 1] Mean : It includes all the values…
Q: The ? of a distribution of scores for a ? is measured by the variability. a- mode; symmetry b-…
A: Hello there, the question you have posted is actually, “The ___ of distribution of scores for a ___…
Q: Which of the following measure the average deviation of a data set? 1. sample range 2. sample…
A: Variance: The average of the square of the deviations taken from the mean is called variance. Sample…
Q: Calculate the variance and standard deviation of the following sample data sets: a.…
A:
Q: Calculate the variance and standard deviation of the sample data shown, to two decimal places X 16.6…
A:
Q: Which of the following is considered a biased estimator? variance proportion median mean
A: Answer and explanation is given below
Q: 35 29 26 33 29 27 30 22 19 29 29 29 32 29 29 33 25 19 19 22 Find the Mean, Median, Mode, Midrange,…
A: We have given the data, first, we have to arrange the data in ascending order. 19 19 19 22 22…
Q: The ages in years of a random sample of shoppers at a gaming store are shown. Determine the range,…
A:
Q: Calculate the mean and sample standard deviation of the data shoWH. places 21 14 26 10 11 23 Mean =…
A: Mean : The mean of a data set is the sum of the terms divided by the total number of terms. Using…
Q: Calculate the standard deviation and variance of the data shown, to two decimal places 8.9 18.5 9.7…
A: Use the given data to form excel table: x x-x¯ x-x¯2 8.9 -6.75 45.5625…
Q: For a given data set, the mean = 20, median = 20 and variance = 16. Then the shape of the…
A: A normal distribution is a probability distribution with the mean as μ and standard deviation as σ.…
Q: This data is from a sample. Calculate the mean, standard deviation, and variance. 10.5 22.7 40.4…
A: Given data,10.5, 22.7, 40.4, 31.9, 34.2, 17.1,39.6, 43.2Sample Mean x¯ = Sum of the observationsno…
Q: For the following table represents the statistical data for ages and their frequencies. Find the…
A: Given. R=N+5+G N=43, G=1 R=43+5+1=49 We will calculate frequency according to the table. We have…
Q: What is the value of the Pearson coefficient of skewness for a distribution with a mean of 27,…
A:
Q: Consider the following sample data. Sample A: 8,13,18 Sample B: 66,71,76 Sample C: 1,025,…
A: From the given information, the 3 samples are as follows: A B C Samples 8, 13, 18 66, 71, 76…
Look for the Variance, Standard Deviation, and z-score
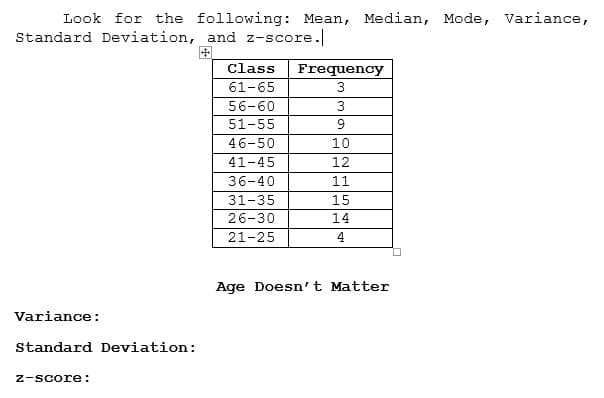
Step by step
Solved in 6 steps with 6 images