1b) Calculate the mean deviation from the mean for the following data: Size : 4 8. 10 12 14 16 Frequency: 4 2.


Q: A researcher has collected the following sample data Calculate coffined of variation, which is the…
A: From the provided information, Type of work Mean (µ) Standard deviation (σ) 1 100 20…
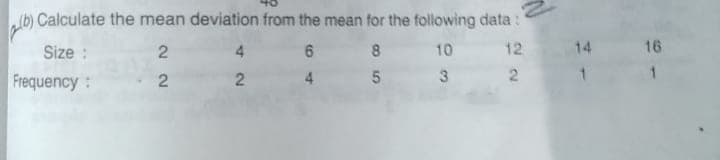
Q: Calculate the mean deviation from the mean for the following data : Size : 2 6 8 10 12 14 16 ency :…
A: We have given that data Mean = sum of all observations/total number of observations.
Q: For the following data set, approximate the sample standard deviation frequency table shows phone…
A:
Q: Given the following observations from a sample, calculate the mean, the median, and the mode. (Round…
A: Calculate Mean, Median, Mode from the following data15,19,19,12,11Mean…
Q: A Student Gender Hours online/week Friends 1 male 2 female 50 L30 3 female 4 female 70 2.
A: Given: The data given is as below Hours online/week Friends 4 90 2 50 2 30 5 70 5 70…
Q: For Problem 19.33 , determine the probability (assuming normal distribution) that a bottle would be…
A: The frequency distribution table is given below: The formula to find mean for any sample is,…
Q: For each set of data: Compute the following: a.) mean, median, and mode. b.) Compute the variance,…
A: Obtaining descriptive statistics for the first data set: The procedure to obtain descriptive…
Q: 3 13 Calculate the mean deviation (from median) from the following data :- Class interval Frequency…
A:
Q: Match the histograms on the right to the summary statistics given. Standard Mean Median Deviation 53…
A: Histogram : A bar graph may be a graphical illustration that divides a group of information points…
Q: For Problem 19.39 , determine the probability (assuming normal distribution) that a tire could be…
A: Here, x f fx x-x (x-x)2 f(x-x)2 30000 15 450000 -12661.9 160322951.9 2404844278 35000 20…
Q: The following data represents the age distribution of a sample of 100 people covered by Health…
A: Note: Hey there! Thank you for the question. As you have posted a question with multiple sub-parts,…
Q: Find the following descriptive statistics for the data described below. a. Mean b. Median c. Mode d.…
A: The given data12,11,1,9,7,8
Q: Calculate mean deviation from mean and median for the following data : Comba 500 100 150 200 250 360…
A: Given : Sample 100 150 200 250 360 490 500 600 671
Q: Match the histograms on the right to the summary statistics given. 20- Standard Deviation Мean…
A: For the given histogram the right to the summary statistics given
Q: Match the histograms on the right to the summary statistics given. Standard Mean Median Deviation 60…
A:
Q: Specify the mathematical symbol used for each of the following descriptive measures. a. Sample mean…
A:
Q: A bakery ownertabulated sales to 50 customers and obtained the distribution. Find the mean and…
A: Mean: The mean is the sum of observations divided by number of observations. that is, Mean = x =…
Q: Coefficient of skewness b. Mean c. Median d. Standard deviation
A: Provided data is: 132, 144, 127, 152, 101 and 165. Arranging data in ascending order; 101, 127, 132,…
Q: 2. Calculate the frequency mean, the frequency standard deviation, the median and the first and…
A: Given a grouped data set And said to calculate its frequency mean, frequency standard…
Q: Given the following sample data set, find the mean, median, mode, and standard deviation. 12 21 17…
A:
Q: Based on the following set of data, compute for the mean, median and mode.
A: Data given 14,15.2,12.9,12.8,13.7,21.0,22.8,14.7,16.9,15.8,15.8,16.3,14.2,16.2,13.9,19.5,20,18.4
Q: Identify the most appropriate measure of variation corresponding to each of the following measures…
A: -
Q: 3. Find the mean, median, mode, and Standard deviation of the following data: 15, 11, 18, 9, 15, 18,…
A: The mean can be calculated as follows:
Q: The following data set belongs to a population: 5 -7 2 0 -9 16 10 7 Calculate the mean,median and…
A: Data Set - 5, -7, 2, 0, -9, 16, 10, 7 Total number of data values = n = 8
Q: 7. Compute mean deviation from mean and median from the following data : Height in cms 158 159 160…
A: Given data is Heights in cms 158 159 160 161 162 163 164 165 166 No.of persons 15 20 32 35 33…
Q: 1. For the following sets of data, find the mean, variance, and standard deviation: 2 6 8 8 8 8 11…
A:
Q: We are going to calculate the standard deviation for the following set of sample data. 8 15 11 6. 3…
A: Given data, 8,5,11,9,3 standard deviation=?
Q: To set aside funds for fuel for mid-level and senior managers, a large financial institution col-…
A: Class(1) Frequency (f)(2) Mid value (x)(3) f⋅x(4)=(2)×(3) cf(6) 0-10 4 5 20 4 10-20 23 15 345 27…
Q: a is used to represent the population proportion level of significance standard deviation population…
A: According to the given information, we haveThe symbol 'α ' is given.
Q: Find the quartile deviation and mean deviation as well as their co-efficients from the following…
A: Given : 58 59 60 61 62 63 64 65 Group A 10 18 30 42 35 28 16 8 Group B 15 20 32 35 33…
Q: Males Females Mean 2.83 2.33 3.54 2.64 p = 0.4606
A: Given : Data MALE FEMALE MEAN 2.83 2.33 STANDARD DEVIATION 3.54 2.64 Mean: It is the…
Q: Look for the following: Mean, Median, Mode, Variance Standard Deviation, and z-score. Class…
A:
Q: Which of the following descriptive statistics is least affected by outliers? Select one: O a.…
A: to find which of the descriptive statistics is least affected by outliers
Q: Use the grouped data formulas to find the indicated mean or standard deviation. For the following…
A: Given data is Height (in inches) Frequency 50 - 52 5 53 - 55 8 56 - 58 12 59 - 61 13 62…
Q: The following grades, Table 1(g), were given for a student assignment, compute the mean, x, the mode…
A: Introduction: When observed data are not in grouped format, they are referred to as ungrouped data.…
Q: Q1: 1-A researcher has collected the following sample data Calculate coffined of variation, which is…
A: We have given the following data and we have to find out the coefficient of variation.
Q: Consider the following sample data. Sample A: Sample B: Sample C: 11, 22, 33 81, 92, 103 1,100;…
A:
Q: C. An agricultural researcher wants to compare the mean numbers of pods between three plot types…
A: Null hypothesis: H0:µ1 = µ2 = µ3 Alternative hypothesis: H0: Not all the population means are equal.…
Q: Q2/ The number of hours worked by 10 employees of small building firm during a week were: 45 46 34…
A: Given data, 45,46,34,47,44,42,46,42,43,44
Q: In the given graph, What is the mean and standard deviation?
A:
Q: Calculate the SEM (standard error of the mean) for the following data: a. Population standard…
A: We have given that, Population standard deviation (σ) = 15 and sample size (n) = 25 Then, We will…
Q: Assuming that the heights of college women are normally distributed with mean 62 inches and standard…
A: If Xis a normal variate with mean=μ, S.D=σ, then Z=x-μσ is a standard normal variate. That is, If…
Q: Calculate the mean deviation (from mean) from the following data :
A: Here use formula of mean deviation
Q: Compute for the mean, the variance and standard deviation of this frequency distribution. Score…
A:
Q: Q1 For the tabulated data, find the (a) mean, (b) median, (c) mode, (d) standard deviation. Classes…
A: The table helps to find the value mean, median, mode and standard deviation. classes Frequency,fi…
Q: Find the median and meản deviation of the following data : Size Frequency Şize Frequency 0-10 7…
A:
Q: Calculate the mean deviation from the mean for the following data : Size : 2 4 6 8 10 12 14 16…
A:
Q: Use a calculator to find the standard deviation of this sample data: 122 141 140 118 155 174 198 133…
A: According to the given information, we have Data set: 122,141,140,118,155,174,198,133,168,195

Step by step
Solved in 2 steps with 1 images
