LOS Angees, CA San Francisco, CA 76 Washington DC, VA, MD 73 Atlanta, GA 71 Houston, TX 67 Dallas, Fort Worth, TX 64 Chicago, IL-IN 62 Detroit, MI 61 Miami, FL 55 Boston, MA, NH, RI 55 New York, NY-NJ-CT 53 Phoenix, AZ 53 Philadelphia, PA-NJ-DE-MD 42 Large Urban Areas Extra Hours per Year per Traveler Riverside, CA 58 Orlando, FL 58 San Jose, CA 56 San Diego, CA 55 Denver, CO 54 Baltimore, MD 53 Seattle, WA 49 Tampa, FL 49 Minneapolis, St Paul, MN 46 Sacramento, CA 43 Portland, OR, WA 42
LOS Angees, CA San Francisco, CA 76 Washington DC, VA, MD 73 Atlanta, GA 71 Houston, TX 67 Dallas, Fort Worth, TX 64 Chicago, IL-IN 62 Detroit, MI 61 Miami, FL 55 Boston, MA, NH, RI 55 New York, NY-NJ-CT 53 Phoenix, AZ 53 Philadelphia, PA-NJ-DE-MD 42 Large Urban Areas Extra Hours per Year per Traveler Riverside, CA 58 Orlando, FL 58 San Jose, CA 56 San Diego, CA 55 Denver, CO 54 Baltimore, MD 53 Seattle, WA 49 Tampa, FL 49 Minneapolis, St Paul, MN 46 Sacramento, CA 43 Portland, OR, WA 42

Glencoe Algebra 1, Student Edition, 9780079039897, 0079039898, 2018
18th Edition
ISBN:9780079039897
Author:Carter
Publisher:Carter
Chapter10: Statistics
Section10.6: Summarizing Categorical Data
Problem 4AGP

Related questions
Question
please answer part A
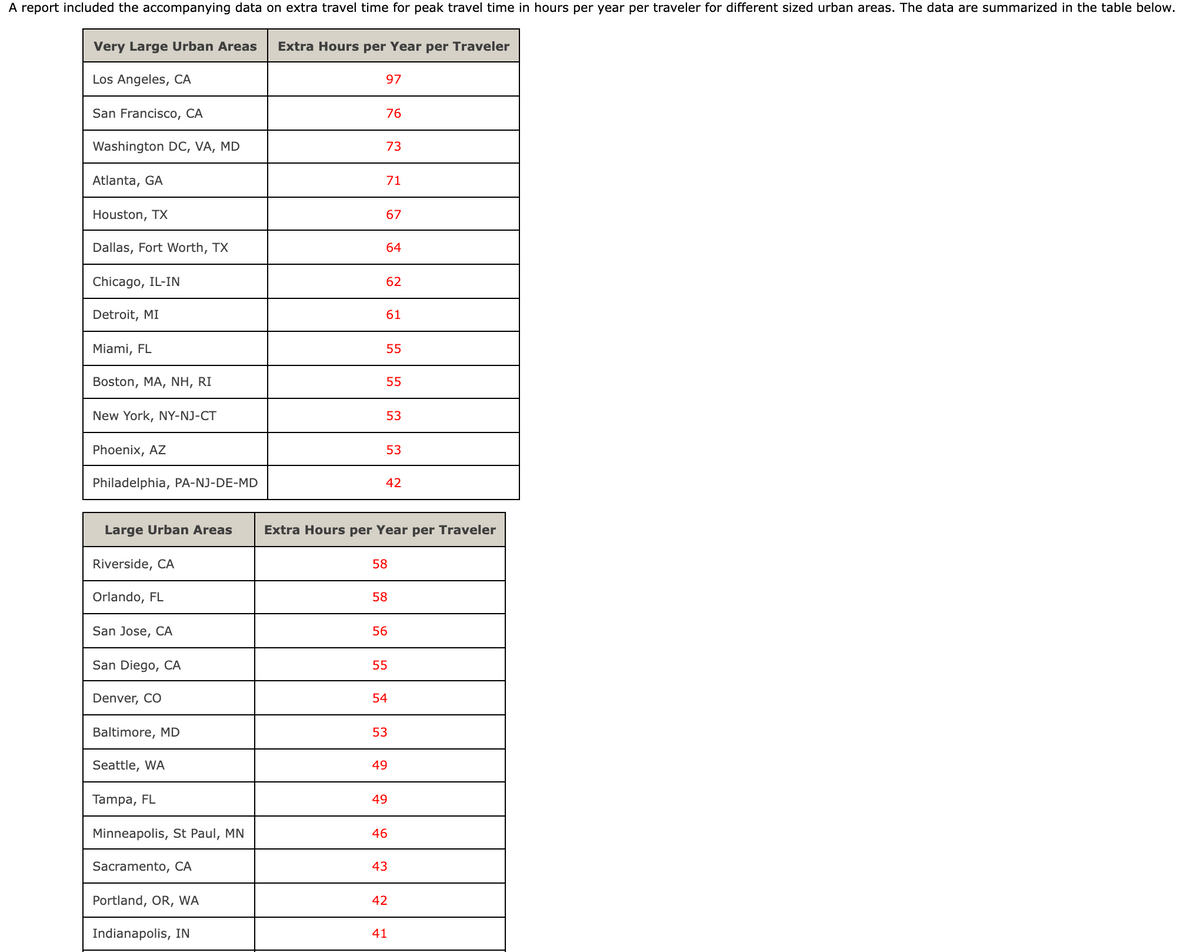
Transcribed Image Text:A report included the accompanying data on extra travel time for peak travel time in hours per year per traveler for different sized urban areas. The data are summarized in the table below.
Very Large Urban Areas
Extra Hours per Year per Traveler
Los Angeles, CA
97
San Francisco, CA
76
Washington DC, VA, MD
73
Atlanta, GA
71
Houston, TX
67
Dallas, Fort Worth, TX
64
Chicago, IL-IN
62
Detroit, MI
61
Miami, FL
55
Boston, MA, NH, RI
55
New York, NY-NJ-CT
53
Phoenix, AZ
53
Philadelphia, PA-NJ-DE-MD
42
Large Urban Areas
Extra Hours per Year per Traveler
Riverside, CA
58
Orlando, FL
58
San Jose, CA
56
San Diego, CA
55
Denver, CO
54
Baltimore, MD
53
Seattle, WA
49
Tampa, FL
49
Minneapolis, St Paul, MN
46
Sacramento, CA
43
Portland, OR, WA
42
Indianapolis, IN
41
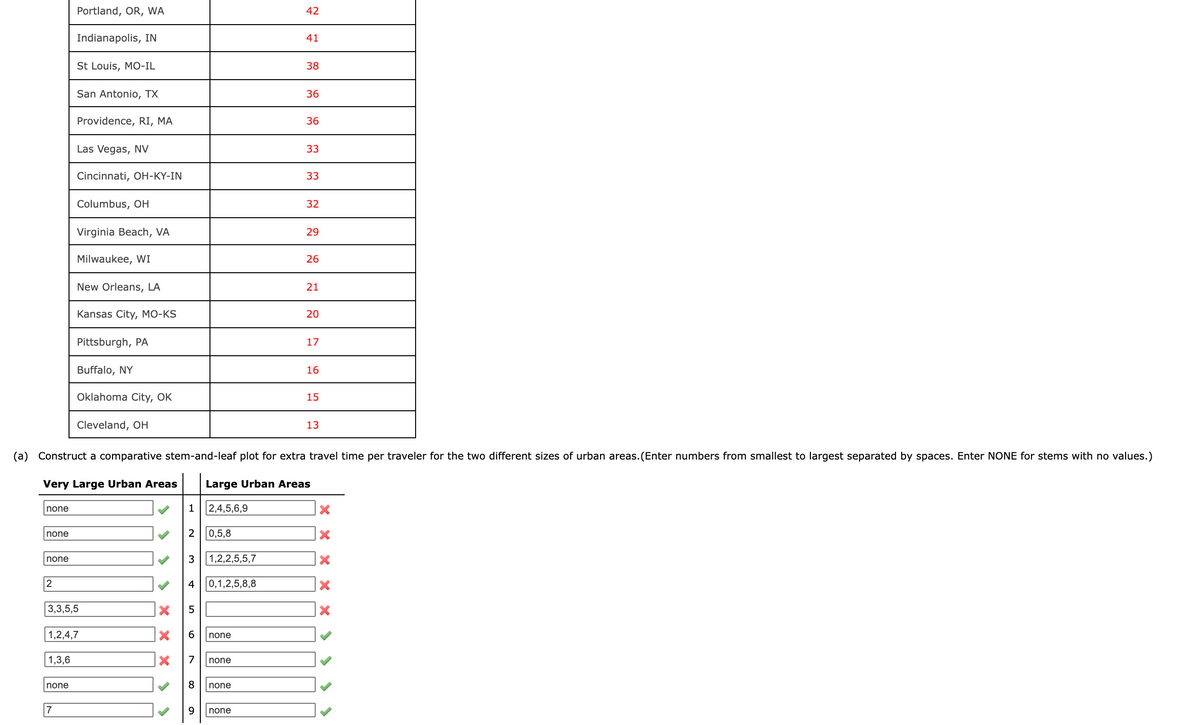
Transcribed Image Text:Portland, OR, WA
42
Indianapolis, IN
41
St Louis, MO-IL
38
San Antonio, TX
36
Providence, RI, MA
36
Las Vegas, NV
33
Cincinnati, OH-KY-IN
33
Columbus, OH
32
Virginia Beach, VA
29
Milwaukee, WI
26
New Orleans, LA
21
Kansas City, MO-KS
20
Pittsburgh, PA
17
Buffalo, NY
16
Oklahoma City, OK
15
Cleveland, OH
13
(a) Construct a comparative stem-and-leaf plot for extra travel time per traveler for the two different sizes of urban areas. (Enter numbers from smallest to largest separated by spaces. Enter NONE for stems with no values.)
Very Large Urban Areas
Large Urban Areas
none
1
2,4,5,6,9
none
2
0,5,8
none
3
1,2,2,5,5,7
2
4
0,1,2,5,8,8
3,3,5,5
1,2,4,7
none
1,3,6
7
none
none
8
none
7
9.
none
Expert Solution
This question has been solved!
Explore an expertly crafted, step-by-step solution for a thorough understanding of key concepts.

This is a popular solution!

Trending now
This is a popular solution!

Step by step
Solved in 2 steps

Recommended textbooks for you
Glencoe Algebra 1, Student Edition, 9780079039897…
Algebra
ISBN:
9780079039897
Author:
Carter
Publisher:
McGraw Hill
Glencoe Algebra 1, Student Edition, 9780079039897…
Algebra
ISBN:
9780079039897
Author:
Carter
Publisher:
McGraw Hill