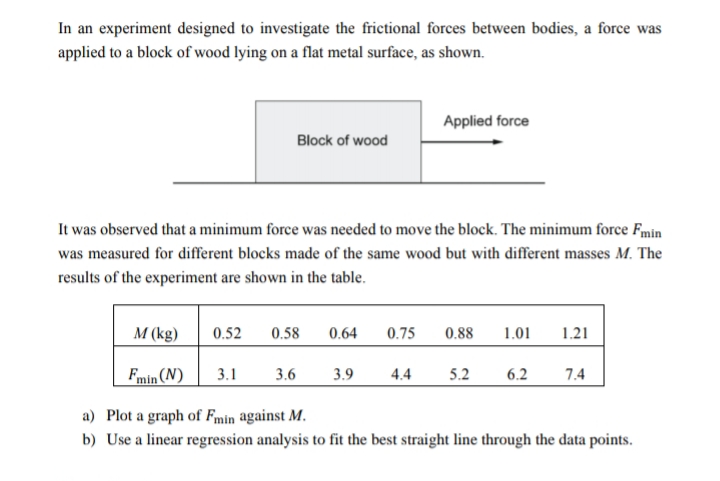
м (sg) 0.52 0.58 0.75 1.01 0.64 0.88 1.21 Fmin (N) 3.6 3.9 7.4 3.1 4.4 5.2 6.2 a) Plot a graph of Fmin against M. b) Use a linear regression analysis to fit the best straight line through the data points.


Nuclear Fusion
Nuclear fusion is a type of nuclear reaction. In nuclear fusion, two or more than two lighter atomic nuclei combine to form a heavier nucleus. During this process, an enormous amount of energy is released. This energy is called nuclear energy. Nuclear fusion is the energy source of the sun and stars.
Fusion Bomb
A fusion bomb is also known as a thermonuclear bomb or hydrogen bomb which releases a large amount of explosive energy during a nuclear chain reaction when the lighter nuclei in it, combine to form heavier nuclei, and a large amount of radiation is released. It is an uncontrolled, self-sustaining nuclear chain reaction where isotopes of hydrogen combine under very high temperature to form helium. They work on the principle of operation of atomic fusion. The isotopes of Hydrogen are deuterium and tritium, where they combine their masses and have greater mass than the product nuclei, get heated at high temperatures, and releases energy.


Trending now
This is a popular solution!

Step by step
Solved in 3 steps with 5 images


