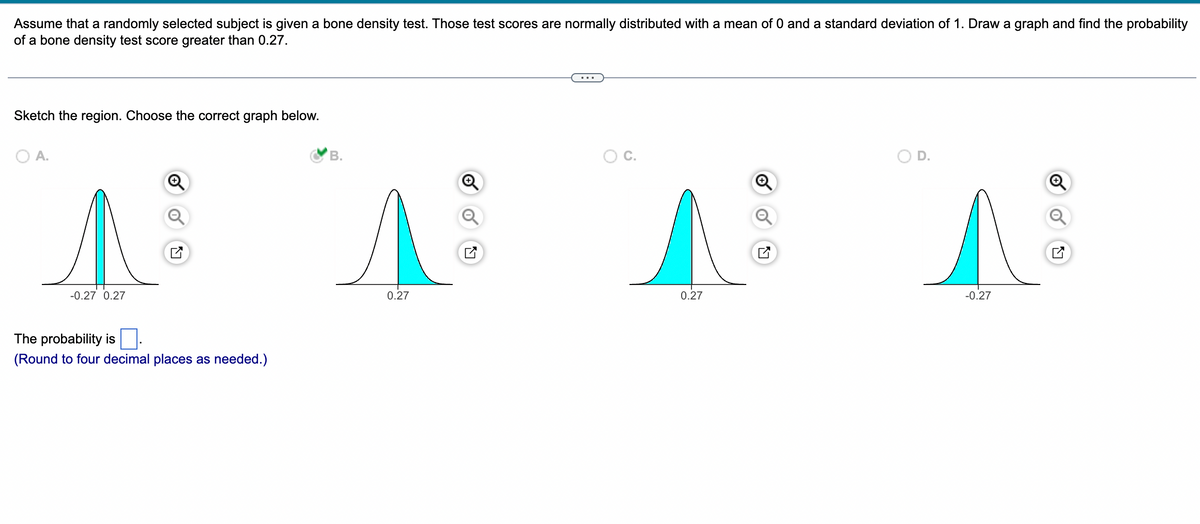
m. Choose the correct graph below. 27 Q ecimal places as needed.) B. A 0.27 Q


Q: Given the probability distributions shown to the right, complete the following parts.
A: Hello! As you have posted more than 3 sub parts, we are answering the first 3 sub-parts. In case…
Q: Which of these is not a binomial probability of X~B(12,0.4)? A. P(X-5) = ¹2Co(0.4)5(0.6)7 B.…
A: Let X be the random variable from binomial distribution with probability of success (p) = 0.4 and…
Q: A researcher is interested in the effects of a “smart drug” on performance on a standardized…
A: We have given that Population mean (µ) = 200Standard deviations (σ) = 50Sample size (n) = 1Sample…
Q: Use the frequency distribution shown below to construct an expanded frequency distribution High…
A: class frequency(f) 15-25 17 26-36 42 37-47 67 48-58 68 59-69 81 70-80 67 81-91 23…
Q: A major oil company has developed a new gasoline additive that is supposed to increase mileage. To…
A: Given The data is as follows: Car 1 2 3 4 5 6 7 8 9 10 Without additive 27.2 13.7 12.5 13.4…
Q: The forecast for each week of a four-week schedule is 50 units. The MPS rule is to schedule…
A: Given information: The data represents the forecast for each week of a four-week schedule.
Q: Market research has shown that 60% of persons who are introduced to a certain product actually buy…
A: Note: Hey there! Thank you for the question. As you have posted multiple questions and several…
Q: In Chapter 5, the calculations themselves aren't too tricky - often the hard part is simply…
A: Note: As per the Bartelby guidelines only three sub-parts can be answered. Kindly resubmit the…
Q: Find the class boundaries. Class limits Class boundaries 0.5-11.4 11.5-22.4 22.5-33.4 33.5-44.4…
A: Class boundaries : If the difference between ( upper limit of one class and lower limit of second…
Q: What is the impact of changing from the 95% confidence interval to the 90% confidence interval? The…
A: Confidence Interval Confidence Interval refers to the range of the value that we expect our estimate…
Q: Find the probability that the average effective time of the pain relief drug for a sample of 25…
A: The mean is 2 hours and the standard deviation is 0.20 hours.
Q: The song-length of tunes in the Big Hair playlist of a Statistics professor's mp3-player varies from…
A: Note: Hi there! Thank you for posting the questions. As there are multiple sub parts, according to…
Q: Find the area of the shaded region. The graph to the right depicts IQ scores of adults, and those…
A: Given information: The mean and standard deviation of X is; μ=100, and σ=15 respectively.
Q: IQ scores form a normal distribution with a mean of μ =105 and a standard deviation of σ = 11.…
A: Let M be the random variable from normal distribution with mean (μ) = 105, standard deviation (σ) =…
Q: Blood pressure is distributed Normally, with a mean of 85 mm and a standard deviation of 20 mm.…
A:
Q: A statistical program is recommended. The National Football League (NFL) records a variety of…
A: Hi! Thank you for the question, As per the honor code, we are allowed to answer three sub-parts at a…
Q: A statistic center compiles data on the length of stay by patients in short-term hospitals. A random…
A: The data shows the length of stay by patients in short-term hospitals.
Q: The average number of defective parts manufactured during a shift at a technology factory is…
A: Introduction: It is required to identify the shift that is doing the best job.
Q: Consumers spend an average mean of $21 per week in cash without being aware of where it goes. Assume…
A: GivenMean(μ)=21standard deviation(σ)=5
Q: 1. Suppose that a variance is thought to be o² = 3. A random sample of n=25 yields a sample standard…
A: Given: Sample size n=25 Population variance σ2=3 Sample standard deviation s=2.1 Significance level…
Q: Consider the following optimization problem: min X + 2Y s.t. 3X+Y≤ 10 After solving it, the optimal…
A: Optimization problems are a common tool in many fields, including economics, engineering, and…
Q: (b) Suppose you are in line to get into the pub. Compute the probability that you will have to wait…
A: Given Information: The amount of time a person spends waiting in line to get into a well-known pub…
Q: The Computer Anxiety Rating Scale (CARS) measures an individual’s level of computer anxiety, on a…
A: Male : Sample mean(M1) = 40.26 Standard deviation(S1) = 13.35 Female : Sample mean (M2) = 36.85…
Q: Problem 6: Suppose we observe a random variable X~ Binomial(n, p). (a) What is the generalized…
A: Given: A random variable X follows Binomial distribution with parameters n and p i.e., X~Binomialn,…
Q: Consider the following simple linear regression model, Y₁ = Bo + B₁X₁ + &₁, for i=1,2,...,n, where…
A:
Q: 1. What is the theoretical probability of picking one diamond deck? d from a standard playing card
A: Here given , There are total 52 cards in standard deck . Four suit in deck and there are 13 cards of…
Q: Insurance Company A claims that its customers pay less for car insurance, on average, than customers…
A: Claim: Insurance Company A claims that its customers pay less for car insurance, on average, than…
Q: A box contains 4 red balls, 3 green balls, and 5 blue balls. If 2 balls are drawn at random without…
A:
Q: Using The t Distribution Table, find the P-value interval for a right-tailed test with n-23 and…
A: The test statistic is t = 2.390 and the sample size is n = 23.
Q: Find the temperature of a person in percentile-94, given that we expect the average temperature to…
A: Given,mean(μ)=98.6standard deviation(σ)=0.7
Q: The weight of frogs in grams in a marsh population are normally distributed with mean (u) equal to…
A: The question is about normal distribution Given : Popl. mean weight of frogs ( μ ) = 23.5 grams…
Q: Complaints about an Internet brokerage firm occur at a rate of 1.1 per day. The number of complaints…
A: Let X1, X2,X3 e the no. of complaints occur at ith day, i=1(1)3Now, from the given information X1,…
Q: The mean IQ for the U.S. is 100 with a standard deviation of 15. A Troy statistics professor thinks…
A: In this statistical problem, we are tasked with determining whether Troy students have a higher IQ…
Q: (c) Determine the following: (1) P(X = 1/2) (ii) P(< X <³) (iii) P(1 ≤ x ≤ 2)
A:
Q: Let X denote the amount of space occupied by an article placed in a 1-ft packing container. The pdf…
A: The random variable X denotes the amount of space occupied by an article placed in a 1-ft3 packing…
Q: A local Netflix shipping facility has 30 copies of the movie Taken which are defect free and 4…
A: 30 defect free copies 4 defective copies _____________ 34 total copies select 2 copies at random…
Q: Here is a probability distribution: X 2 4 7 10 P(X) 0.3 0.05 0.3 0.35 Find the mean of this…
A: Solution-: We have given following probability distribution: X P(X) 2 0.3 4 0.05 7 0.3…
Q: Suppose the amount of time it takes a student to complete a multiple-choice exam with 50 questions…
A: Given that. X~N( μ , ?) μ=60 , ?=10 Z-score =( x - μ )/?
Q: The following multiple regression printout can be used to predict the price (Price) of a used car…
A: Introduction The multiple linear regression shows the relationship b/w one dependent variable and 2…
Q: The Consumer Reports Restaurant Customer Satisfaction Survey is based upon 148,599 visits to…
A: Given:- The Consumer Reports Restaurant Customer Satisfaction Survey is based upon…
Q: A test is made of H0 : my =62 versus H1> 62. A sample of size n = 75 is drawn, and the sample mean…
A: The given sample size is 75, sample mean is 67, population mean is 62 and population standard…
Q: The Computer Anxiety Rating Scale (CARS) measures an individual’s level of computer anxiety, on a…
A: t = (M1 - M2)/√[(Sp2*(1/n1 + 1/n2))] Sp2 = [(df1*S12) + (df2*S22)]/(df1 + df2) Given : N1 = 40…
Q: Suppose a company has two factories that produce a particular product. The first factory produces…
A: event A : product of first factoryevent B : product of second factoryevent D : product is…
Q: he numbers racket is a well‑entrenched illegal gambling operation in most large cities. One version…
A:
Q: calcium into their milk. Some of the calcium may come from their bones, so mothers may lose bone…
A: Given that Sample size n =47 Population standard deviation =2.5
Q: Find the area of the shaded region. The graph to the right depicts IQ scores of adults, and those…
A: Let X be the random variable from normal distribution with mean (μ) = 100 and standard deviation (σ)…
Q: Confirm test results in part (c) using JASP.
A: First Enter the data in Excel.
Q: The following multiple regression printout can be used to predict a person's height (in inches)…
A: The question is about regression Given : Coef. of constant = 55.26 Coef. of Shoe size = 1.167 Coef.…
Q: The arrows can only be dragged to z scores that are accurate to 1 place after the decimal point…
A: Solution-: We want to (a) Sketch the region corresponding to the statement P(Z>1.6) (b)…
Q: Find the area of the shaded region. The graph depicts the standard normal distribution of bone…
A: Here the given graph is we have to find the area of the shaded region

Step by step
Solved in 2 steps with 1 images
