Magnitudes

Glencoe Algebra 1, Student Edition, 9780079039897, 0079039898, 2018
18th Edition
ISBN:9780079039897
Author:Carter
Publisher:Carter
Chapter10: Statistics
Section10.6: Summarizing Categorical Data
Problem 4BGP

Related questions
Question
Need help with a review statistics question ASAP
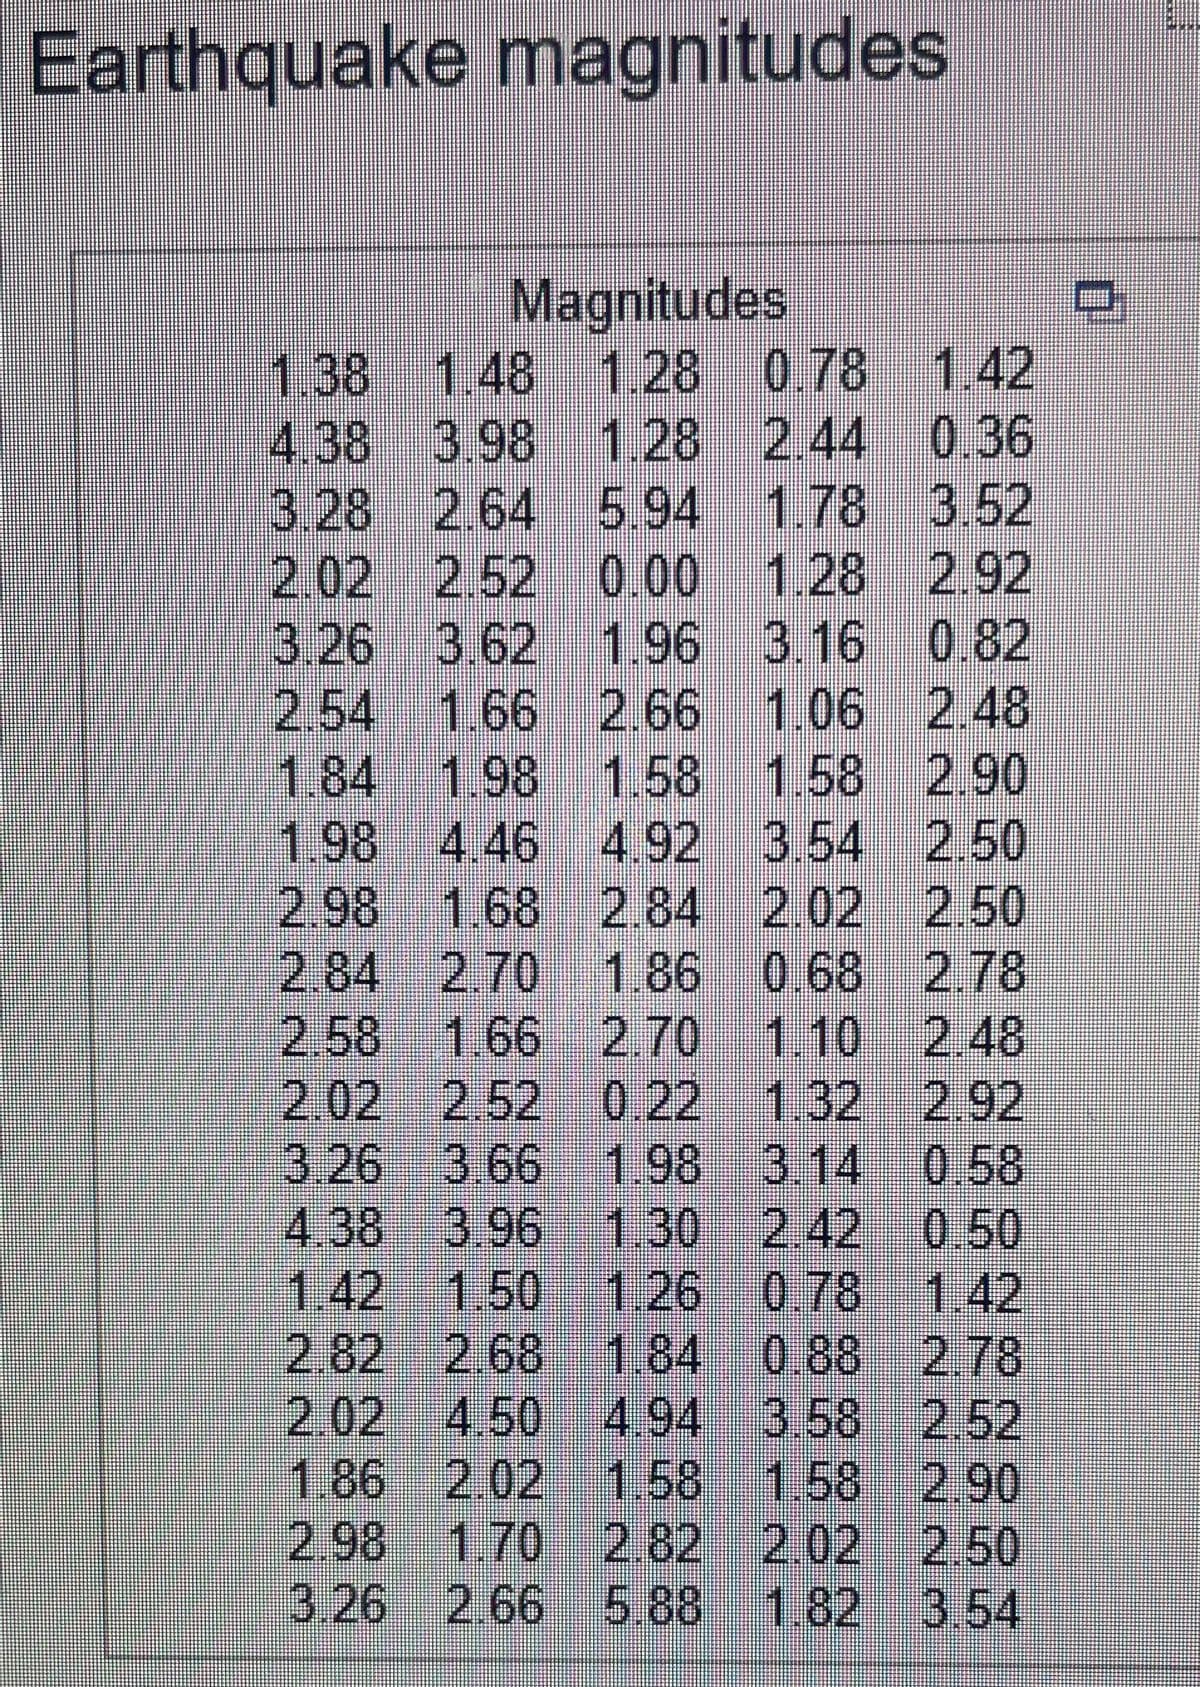
Transcribed Image Text:Earthquake magnitudes
Magnitudes
1.38 1.48 1.28 0.78 1.42
4.38 3.98 1.28 2.44 0.36
3.28 2.64 5.94 1.78 3.52
2.02 2.52 0.00 1.28 2.92
3.26 3.62 1.96 3.16 0.82
2.54 1.66 2.66 1.06 2.48
1.841.98 1.58 1.58 2.90
1.98 4.46 4.92 3.54 2.50
2.98 1.68 2.84 2.02 2.50
2.84 2.70 1.86 0 68 2.78
1.10 2.48
1.32 2.92
3.14 0.58
4,38 3.96 -1,30 2,42 0.50
1.42
2.82 2.68 1.84 0.88 2.78
2.02 4.50 4.94 3.58 2.52
1.58 2.90
2.50
3.54
2.58 1.66 2.70
2.02 2.52 0.22
3.26 366 1.98
1.42 1.50
1.26 0.78
186 2.02 1.58
2.98 1.70 2.82 2.02
3.26 2.66 5.88 1.82
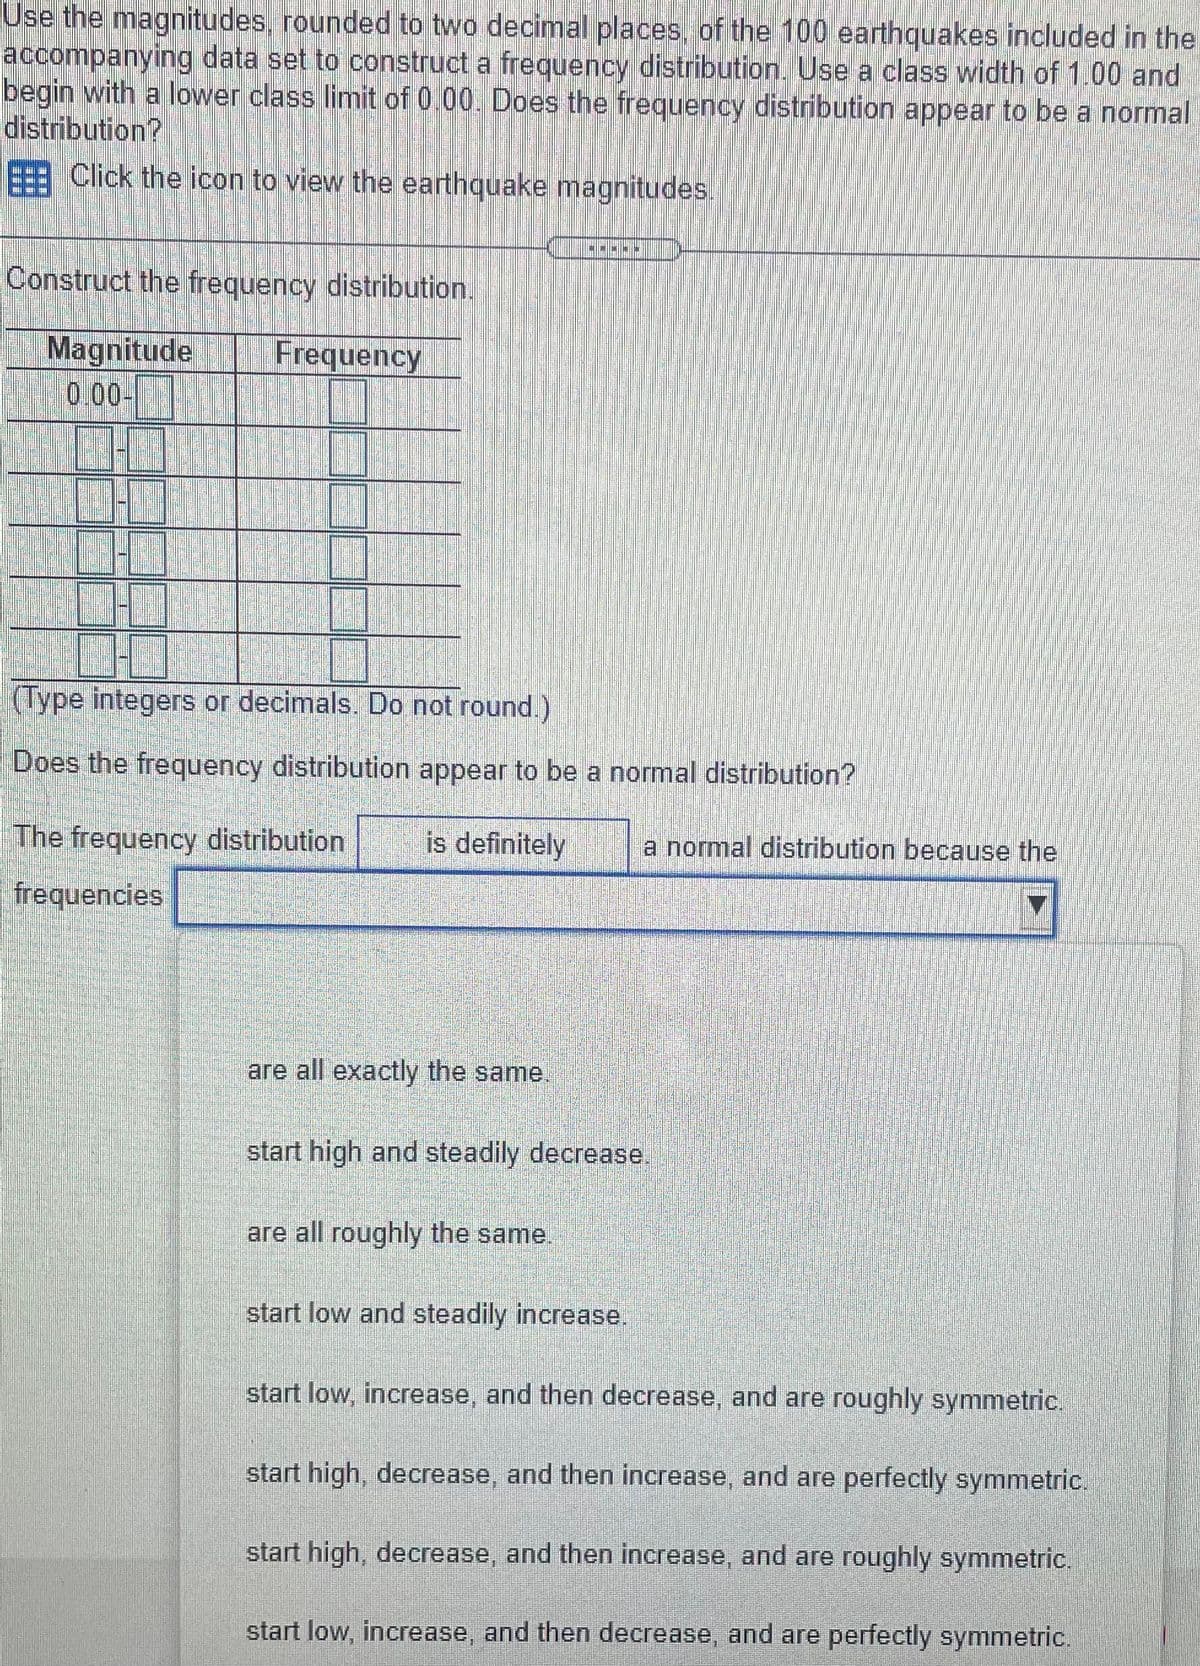
Transcribed Image Text:Use the magnitudes, rounded to two decimal places, of the 100 earthquakes included in the
accompanying data set to construct a frequency distribution. Use a class width of 1.00 and
begin with a lower class limit of 0.00. Does the frequency distribution appear to be a normal
distribution?
Click the icon to view the earthquake magnitudes.
Construct the frequency distribution.
Magnitude
0.00-
Frequency
(Type integers or decimals. Do not round.)
Does the frequency distribution appear to be a normal distribution?
The frequency distribution
is definitely
a normal distribution because the
frequencies
are all exactly the same.
start high and steadily decrease.
are all roughly the same.
start low and steadily increase.
start low, increase, and then decrease, and are roughly symmetric.
start high, decrease, and then increase, and are perfectly symmetric.
start high, decrease, and then increase, and are roughly symmetric.
start low, increase, and then decrease, and are perfectly symmetric.
Expert Solution
This question has been solved!
Explore an expertly crafted, step-by-step solution for a thorough understanding of key concepts.

Step by step
Solved in 2 steps

Recommended textbooks for you
Glencoe Algebra 1, Student Edition, 9780079039897…
Algebra
ISBN:
9780079039897
Author:
Carter
Publisher:
McGraw Hill

Holt Mcdougal Larson Pre-algebra: Student Edition…
Algebra
ISBN:
9780547587776
Author:
HOLT MCDOUGAL
Publisher:
HOLT MCDOUGAL
Glencoe Algebra 1, Student Edition, 9780079039897…
Algebra
ISBN:
9780079039897
Author:
Carter
Publisher:
McGraw Hill
Holt Mcdougal Larson Pre-algebra: Student Edition…
Algebra
ISBN:
9780547587776
Author:
HOLT MCDOUGAL
Publisher:
HOLT MCDOUGAL