Major League Baseball (MLB) pitching statistics were reported for a random sample of 20 pitchers from the American League for one full season.
Major League Baseball (MLB) pitching statistics were reported for a random sample of 20 pitchers from the American League for one full season.

Functions and Change: A Modeling Approach to College Algebra (MindTap Course List)
6th Edition
ISBN:9781337111348
Author:Bruce Crauder, Benny Evans, Alan Noell
Publisher:Bruce Crauder, Benny Evans, Alan Noell
Chapter5: A Survey Of Other Common Functions
Section5.1: Logistic Functions
Problem 5E: Special Rounding Instructions When you perform logistic regression, round the r value to three...

Related questions

Question
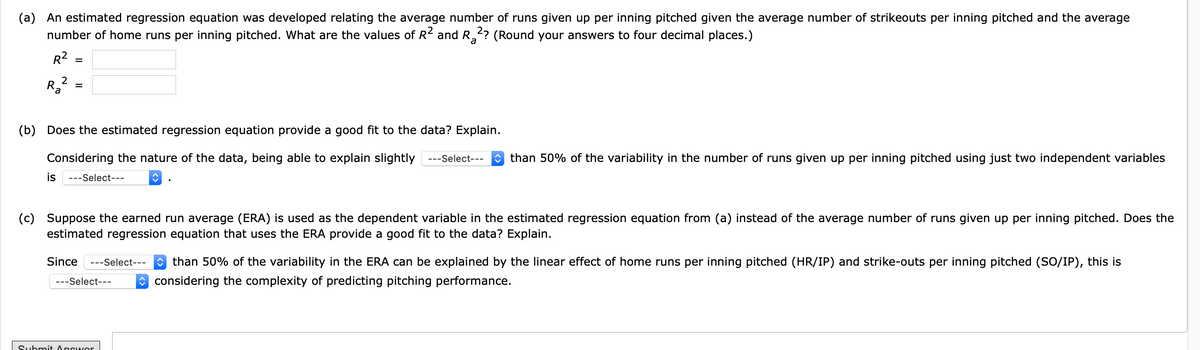
Transcribed Image Text:(a) An estimated regression equation was developed relating the average number of runs given up per inning pitched given the average number of strikeouts per inning pitched and the average
number of home runs per inning pitched. What are the values of R and R,? (Round your answers to four decimal places.)
a
R2
%3D
(b) Does the estimated regression equation provide a good fit to the data? Explain.
Considering the nature of the data, being able to explain slightly ---sSelect---
O than 50% of the variability in the number of runs given up per inning pitched using just two independent variables
is
---Select---
(c) Suppose the earned run average (ERA) is used as the dependent variable in the estimated regression equation from (a) instead of the average number of runs given up per inning pitched. Does the
estimated regression equation that uses the ERA provide a good fit to the data? Explain.
Since
---Select--- than 50% of the variability in the ERA can be explained by the linear effect of home runs per inning pitched (HR/IP) and strike-outs per inning pitched (SO/IP), this is
---Select--
O considering the complexity of predicting pitching performance.
Submit Answor
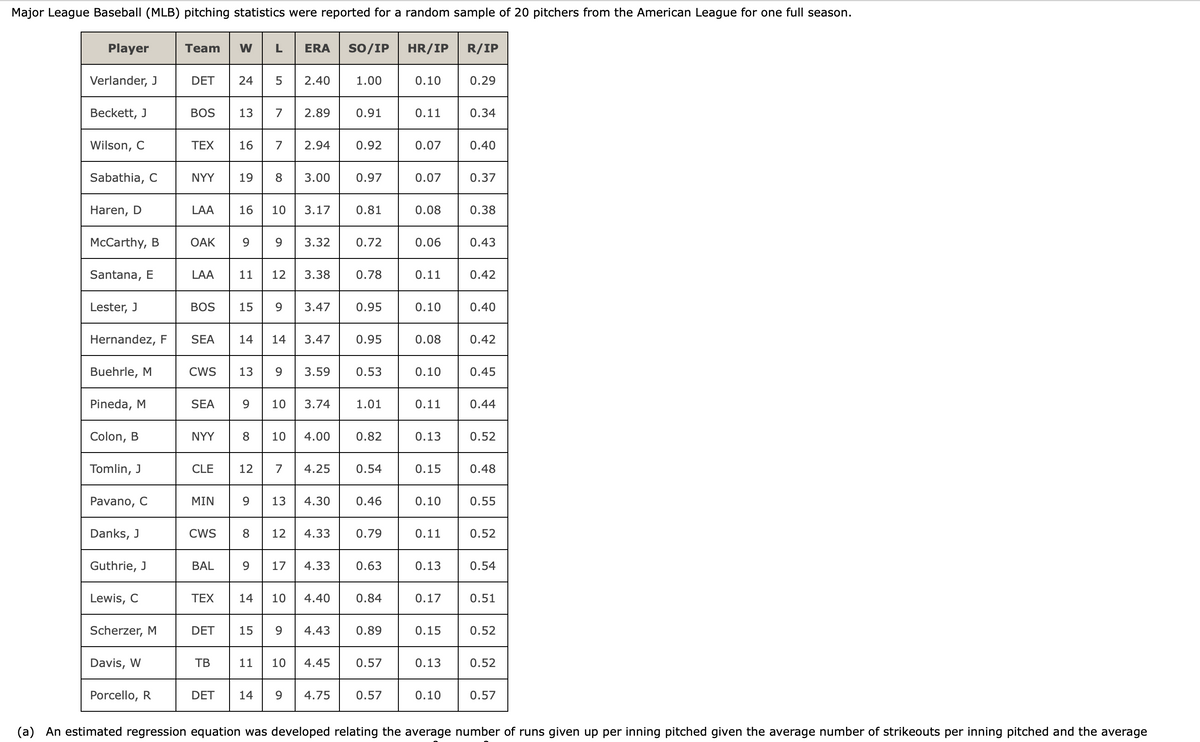
Transcribed Image Text:Major League Baseball (MLB) pitching statistics were reported for a random sample of 20 pitchers from the American League for one full season.
Player
Team
W
L
ERA
so/IP
HR/IP R/IP
Verlander, J
DET
2.40
1.00
0.10
0.29
Beckett, J
BOS
13
7
2.89
0.91
0.11
0.34
Wilson, C
TEX
16
2.94
0.92
0.07
0.40
Sabathia, C
NYY
19
3.00
0.97
0.07
0.37
Haren, D
LAA
16
10
3.17
0.81
0.08
0.38
McCarthy, B
OAK
9.
3.32
0.72
0.06
0.43
Santana, E
LAA
11
12
3.38
0.78
0.11
0.42
Lester, J
BOS
15
9
3.47
0.95
0.10
0.40
Hernandez, F
SEA
14
14
3.47
0.95
0.08
0.42
Buehrle, M
CWS
13
3.59
0.53
0.10
0.45
Pineda, M
SEA
9
10
3.74
1.01
0.11
0.44
Colon, B
NYY
8
10
4.00
0.82
0.13
0.52
Tomlin, J
CLE
12
7
4.25
0.54
0.15
0.48
Pavano, C
MIN
9.
13
4.30
0.46
0.10
0.55
Danks, J
CWS
8
12
4.33
0.79
0.11
0.52
Guthrie, J
BAL
9.
17
4.33
0.63
0.13
0.54
Lewis, C
TEX
14
10
4.40
0.84
0.17
0.51
Scherzer, M
DET
15
4.43
0.89
0.15
0.52
Davis, W
ТВ
11
10
4.45
0.57
0.13
0.52
Porcello, R
DET
14
9.
4.75
0.57
0.10
0.57
(a) An estimated regression equation was developed relating the average number of runs given up per inning pitched given the average number of strikeouts per inning pitched and the average
24
Expert Solution
This question has been solved!
Explore an expertly crafted, step-by-step solution for a thorough understanding of key concepts.

This is a popular solution!

Trending now
This is a popular solution!

Step by step
Solved in 4 steps with 2 images

Knowledge Booster


Learn more about
Need a deep-dive on the concept behind this application? Look no further. Learn more about this topic, statistics and related others by exploring similar questions and additional content below.Recommended textbooks for you
Functions and Change: A Modeling Approach to Coll…
Algebra
ISBN:
9781337111348
Author:
Bruce Crauder, Benny Evans, Alan Noell
Publisher:
Cengage Learning

Algebra and Trigonometry (MindTap Course List)
Algebra
ISBN:
9781305071742
Author:
James Stewart, Lothar Redlin, Saleem Watson
Publisher:
Cengage Learning

College Algebra
Algebra
ISBN:
9781305115545
Author:
James Stewart, Lothar Redlin, Saleem Watson
Publisher:
Cengage Learning
Functions and Change: A Modeling Approach to Coll…
Algebra
ISBN:
9781337111348
Author:
Bruce Crauder, Benny Evans, Alan Noell
Publisher:
Cengage Learning
Algebra and Trigonometry (MindTap Course List)
Algebra
ISBN:
9781305071742
Author:
James Stewart, Lothar Redlin, Saleem Watson
Publisher:
Cengage Learning
College Algebra
Algebra
ISBN:
9781305115545
Author:
James Stewart, Lothar Redlin, Saleem Watson
Publisher:
Cengage Learning

Algebra & Trigonometry with Analytic Geometry
Algebra
ISBN:
9781133382119
Author:
Swokowski
Publisher:
Cengage

Glencoe Algebra 1, Student Edition, 9780079039897…
Algebra
ISBN:
9780079039897
Author:
Carter
Publisher:
McGraw Hill