Male Female 122 2290 The data represent the number of driving fatalities for a certain area by age for male and temale drivers under 16 176 16-20 4704 21-34 13,023 4442 35-54 12,485 4626 55-69 4427 2161 70 and over 3273 1650 (a) What is the probabiity that a randomly selected driver fatality who wAS male was 35 to 54 years o d? The probability that a randomiy selected driver fatality who was male was 35 to 54 years old is oporoxuale y (Round to three decimal places as needed) (b) What is the probability that a randomy selected driver fatal ty who was 35 to 54 was male? The probability that a randomly selected driver fatality who was 35 to 54 was male is aporoxanately Roundi in thee deciral placos as needod.) (c) Is a victim of a fatal accident aged 35 to 54 more lkely to be mae or femsle? Clioocc the comet statement be ow O A. The driver is more likely to be male because the probanity is y'cater th 0.5 OB. The driver is more likelv to be female because the urobshiutv is less than 05 More
Male Female 122 2290 The data represent the number of driving fatalities for a certain area by age for male and temale drivers under 16 176 16-20 4704 21-34 13,023 4442 35-54 12,485 4626 55-69 4427 2161 70 and over 3273 1650 (a) What is the probabiity that a randomly selected driver fatality who wAS male was 35 to 54 years o d? The probability that a randomiy selected driver fatality who was male was 35 to 54 years old is oporoxuale y (Round to three decimal places as needed) (b) What is the probability that a randomy selected driver fatal ty who was 35 to 54 was male? The probability that a randomly selected driver fatality who was 35 to 54 was male is aporoxanately Roundi in thee deciral placos as needod.) (c) Is a victim of a fatal accident aged 35 to 54 more lkely to be mae or femsle? Clioocc the comet statement be ow O A. The driver is more likely to be male because the probanity is y'cater th 0.5 OB. The driver is more likelv to be female because the urobshiutv is less than 05 More

Algebra & Trigonometry with Analytic Geometry
13th Edition
ISBN:9781133382119
Author:Swokowski
Publisher:Swokowski
Chapter10: Sequences, Series, And Probability
Section10.8: Probability
Problem 47E

Related questions
Question
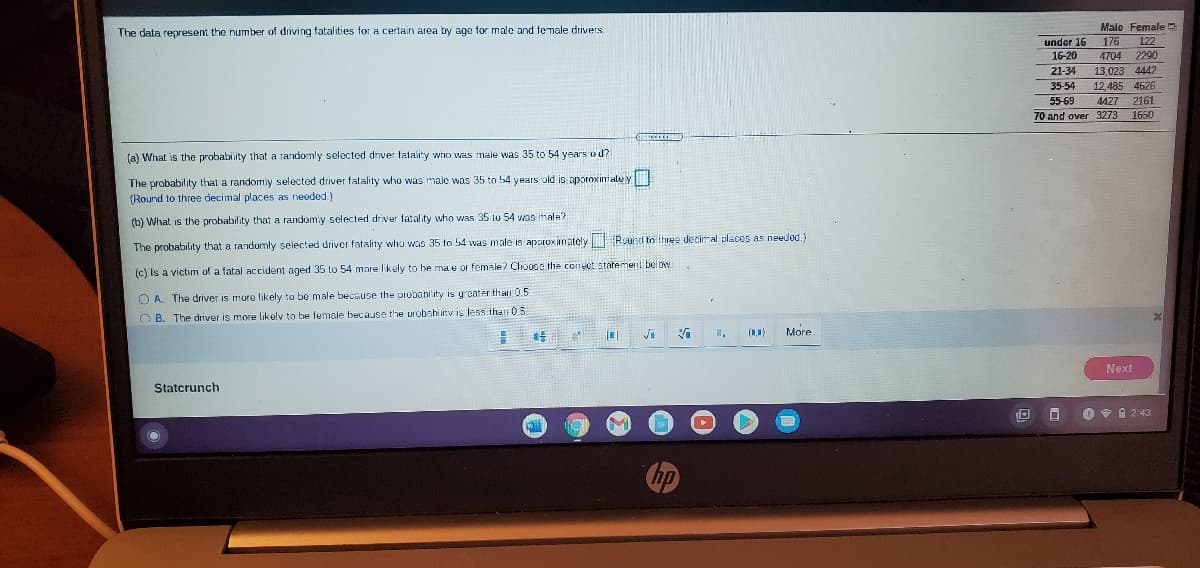
Transcribed Image Text:Male Female E
The data represent the number
driving fatalities for a certain area by age for male and female drivers
under 16
176
122
4704
13,023
12,485 4626
4427 2161
16-20
2290
21-34
4442
35-54
55-69
70 and over 3273 1650
(a) What is the probability that a randomly selected driver fatality who was male was 35 to 54 years ud?
The probability that a randomiy selected driver fatality who was male was 35 to 54 years old is aporoximale y
(Round to three decimal places as needed.)
(b) What is the probability that a randomly selected driver fatality who was 35 to 54 was male?
The probability that a randomly selected driver fatality who was 35 to 54 was male is aporox imately (Rounti tn thee deciral placos as needed.)
(c) Is a victim of a fatal accident aged 35 to 54 mare l'kely to be ma e or female? Clioose the comct statemerit below
O A. The driver is more likely to be male because the probahility is y'cater than 0.5
O B. The driver is more likelv to be female because the urobahitv is less than 0 5.
More
Next
Statcrunch
O 9 1 2:43
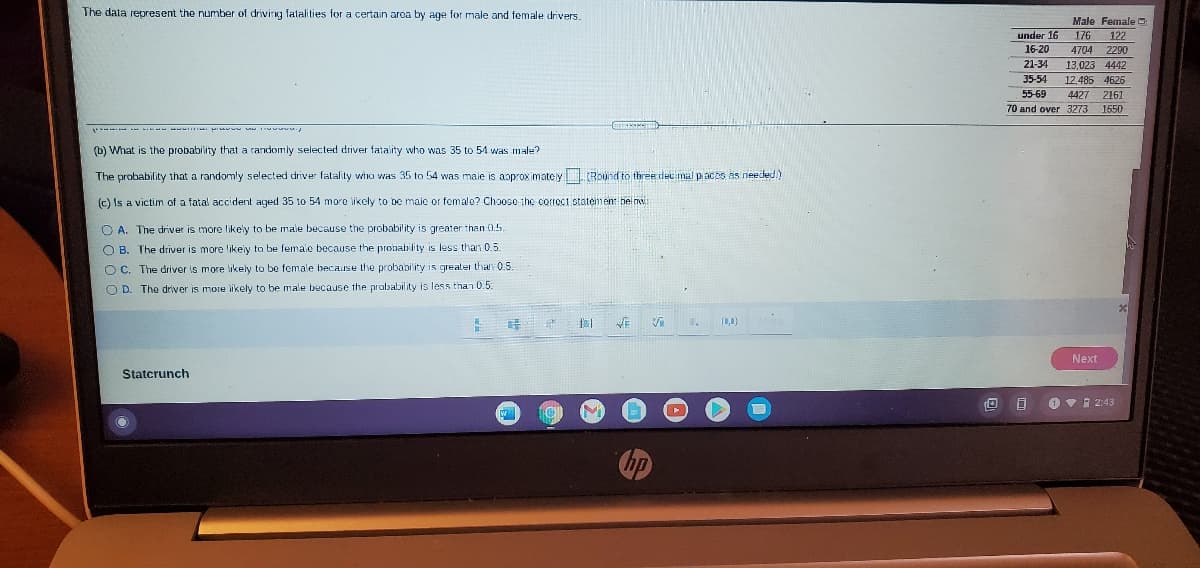
Transcribed Image Text:The data represent the number of driving fatalities for a certain aroa by age for male and female drivers.
Male Female O
under 16
16-20
176
122
4704
2290
21-34
13,023 4442
35-54
12,485 4626
55-69
4427 2161
70 and over 3273
1650
(b) What is the probability that a randomly selected driver fatality who was 35 to 54 was male?
The probability that a randomly selected driver falality wiro was 35 to 54 was maie is aoprox imatey Round to three dec mal p ac es as needed )
(c) Is a victim of a fatal accident aged 35 to 54 more likcly to be male or female? Choose the correct statemen: belnw
O A. The driver is more likely to be male because the probability is greater than 0.5.
O B. The driver is more like'y to be female because the probability is less than 0.5.
O C. The driver is more likely to be female because the probability is greater than 0.5.
O D. The driver is more likely to be male because the probability is less than 0.5.
Next
Statcrunch
O Vi 2:43
Expert Solution
This question has been solved!
Explore an expertly crafted, step-by-step solution for a thorough understanding of key concepts.

This is a popular solution!

Trending now
This is a popular solution!

Step by step
Solved in 4 steps

Recommended textbooks for you
Algebra & Trigonometry with Analytic Geometry
Algebra
ISBN:
9781133382119
Author:
Swokowski
Publisher:
Cengage

Functions and Change: A Modeling Approach to Coll…
Algebra
ISBN:
9781337111348
Author:
Bruce Crauder, Benny Evans, Alan Noell
Publisher:
Cengage Learning

College Algebra
Algebra
ISBN:
9781305115545
Author:
James Stewart, Lothar Redlin, Saleem Watson
Publisher:
Cengage Learning
Algebra & Trigonometry with Analytic Geometry
Algebra
ISBN:
9781133382119
Author:
Swokowski
Publisher:
Cengage
Functions and Change: A Modeling Approach to Coll…
Algebra
ISBN:
9781337111348
Author:
Bruce Crauder, Benny Evans, Alan Noell
Publisher:
Cengage Learning
College Algebra
Algebra
ISBN:
9781305115545
Author:
James Stewart, Lothar Redlin, Saleem Watson
Publisher:
Cengage Learning