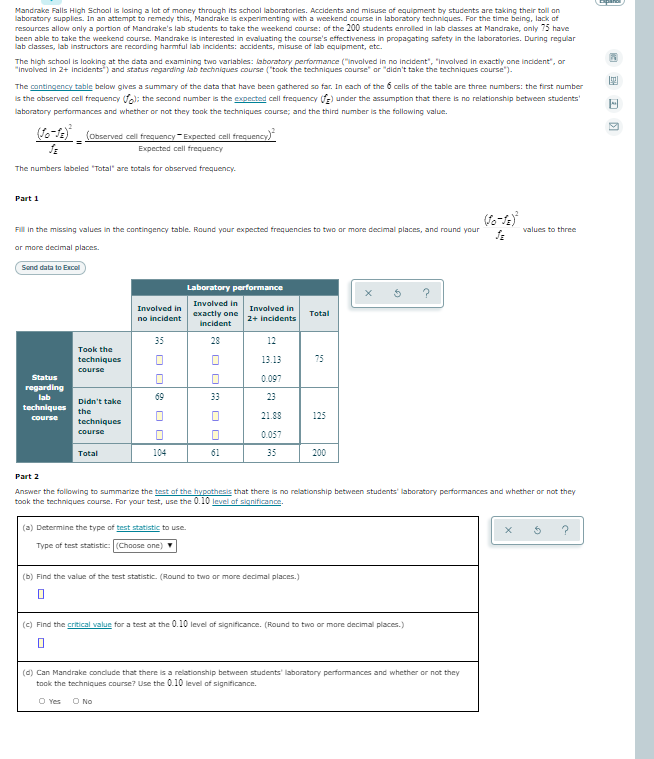
Mandrake Falls High School is losing a lat of money through its school laboratories. Accidents and misuse of equipment by students are taking their toll on laboratory supplies. In an attempt to remedy this, Mandrake is experimenting with a weekend cnurse in laboratory techniques. For the time being, lack of resources allow anly a portion of Mandrake's lab students to take the weekend course: of the 200 students enrolled in lab classes at Mandrake, only 75 have been able to take the weekend course. Mandrake is interested in evaluating the course's effectiveness in propagating safety in the laboratories. During regular lab classes, lab instructors are recording harmful lab incidents: accidents, misuse of lab equipment, etc. The high school is looking at the data and examining two variables: laboratory performance ("invalved in no incident", "Invalved in exactly one indident", or "Involved in 2+ Incidents") and status regarding lab techniques course ("tock the techniques course" or "didn't take the techniques course"). The cantingnney tahle below gives a summary of the data that have been gathered so far. In each of the 6 cnils of the table are three numbers: the first number is the observed cell frequency fo): the second number is the pxpected cell frequency e) under the assumption that there is no relationship between students' laboratory performances and whether or not they took the techniques course; and the third number is the following valua. (fo-fe) (obsarved cell frequency"Expected cell frequency) Expected cell frequency The numbers labeled "Total" are totals for observed frequency. Part 1 Fil in the missing values in the contingency table. Round your expected frequencies to two or more decimal places, and round your values to three ar more decimal places. Sond data to Excel Laboratory performance Involved in Involved in Involved in ехactiy one Total no incident 2+ incidents incident 35 28 12 Took the techniques 13.13 75 course Status regarding 0.097 lab 69 33 23 Didn't take techniques the 21.88 125 course techniques course 0.057 Total 104 61 35 200 Part 2 Answer the following to summarize the test of the hypothesis that there is no relationship between students' laboratory performances and whether or not they took the techniques course. For your test, use the 0.10 Invel of significance- (a) Determine the type of test statistic to use. Type of test statistic: (Choose one) (b) Find the value of the test statistic. (Round to two or more decimal places.) (e) Find the critical valun for a test at the 0.10 level of significance. (Round to two or mare decimal places.) (d) Can Mandrake condlude that there is a relationship between students' laboratory performances and whether or not they took the techniques course? Use the 0.10 level of significance. O Yes O No
Mandrake Falls High School is losing a lat of money through its school laboratories. Accidents and misuse of equipment by students are taking their toll on laboratory supplies. In an attempt to remedy this, Mandrake is experimenting with a weekend cnurse in laboratory techniques. For the time being, lack of resources allow anly a portion of Mandrake's lab students to take the weekend course: of the 200 students enrolled in lab classes at Mandrake, only 75 have been able to take the weekend course. Mandrake is interested in evaluating the course's effectiveness in propagating safety in the laboratories. During regular lab classes, lab instructors are recording harmful lab incidents: accidents, misuse of lab equipment, etc. The high school is looking at the data and examining two variables: laboratory performance ("invalved in no incident", "Invalved in exactly one indident", or "Involved in 2+ Incidents") and status regarding lab techniques course ("tock the techniques course" or "didn't take the techniques course"). The cantingnney tahle below gives a summary of the data that have been gathered so far. In each of the 6 cnils of the table are three numbers: the first number is the observed cell frequency fo): the second number is the pxpected cell frequency e) under the assumption that there is no relationship between students' laboratory performances and whether or not they took the techniques course; and the third number is the following valua. (fo-fe) (obsarved cell frequency"Expected cell frequency) Expected cell frequency The numbers labeled "Total" are totals for observed frequency. Part 1 Fil in the missing values in the contingency table. Round your expected frequencies to two or more decimal places, and round your values to three ar more decimal places. Sond data to Excel Laboratory performance Involved in Involved in Involved in ехactiy one Total no incident 2+ incidents incident 35 28 12 Took the techniques 13.13 75 course Status regarding 0.097 lab 69 33 23 Didn't take techniques the 21.88 125 course techniques course 0.057 Total 104 61 35 200 Part 2 Answer the following to summarize the test of the hypothesis that there is no relationship between students' laboratory performances and whether or not they took the techniques course. For your test, use the 0.10 Invel of significance- (a) Determine the type of test statistic to use. Type of test statistic: (Choose one) (b) Find the value of the test statistic. (Round to two or more decimal places.) (e) Find the critical valun for a test at the 0.10 level of significance. (Round to two or mare decimal places.) (d) Can Mandrake condlude that there is a relationship between students' laboratory performances and whether or not they took the techniques course? Use the 0.10 level of significance. O Yes O No

Linear Algebra: A Modern Introduction
4th Edition
ISBN:9781285463247
Author:David Poole
Publisher:David Poole
Chapter2: Systems Of Linear Equations
Section2.4: Applications
Problem 28EQ

Related questions
Question
Transcribed Image Text:Mandrake Falls High School is losing a lot of money through its school laboratories. Accidents and misuse of equipment by students are taking their toll on
laboratory supplies. In an attempt to remedy this, Mandrake is experimenting with a weekend course in laboratory techniques. For the time being, lack of
resources allow only a portion of Mandrake's lab students to take the weekend course: of the 200 students enrolled in lab classes at Mandrake, only 75 have
been able to take the weekend course. Mandrake is interested in evaluating the course's effectiveness in propagating safety in the laboratories. During regular
lab classes, lab instructors are recording harmful lab incidents: accidents, misuse of lab equipment, etc.
The high school is looking at the data and examining two variables: laboratory performance ("involved in no incident", "Invalved in exactly one incident", or
"involved in 2+ incidents") and status regarding lab techniques course ("took the techniques course" or "didn't take the techniques course").
The contingency table below gives a summary of the data that have been gathered so far. In each of the 6 cells of the table are three numbers: the first number
is the observed cell frequency fo); the second number iis the expected cell frequency e) under the assumption that there is no relationship between students'
laboratory performances and whether or not they took the techniques course; and the third number is the following value.
Jo-JE) (observed cell frequency-Expected cell frequency)
Expected cell frequency
The numbers labeled "Total" are totals for observed frequency.
Part 1
Fill in the missing values in the contingency table. Round your expected frequencies to two or more decimal places, and round your
values to three
ar more decimal places.
Sand data to Excel
Laboratory performance
Involved in
Involved in
Involved in
exactly one
Total
no incident
2+ incidents
incident
35
28
12
Took the
techniques
13.13
75
course
Status
0.097
regarding
lab
69
33
23
Didn't take
techniques
the
21.88
125
course
techniques
course
0.057
Total
104
61
35
200
Part 2
Answer the following to summarize the test of the hypothesis that there is no relationship between students' laboratory performances and whether or not they
took the techniques course. For your test, use the 0.10 level af significance.
(a) Determine the type of test statistic to use.
?
Type of test statistic: (Choose one)
(b) Find the value of the test statistic. (Round to two or more decimal places.)
(c) Find the critical value for a test at the 0.10 level af significance. (Round to two or mare decimal places.)
(d) Can Mandrake condlude that there is a relationship between students' laboratory performances and whether or not they
took the techniques course? Use the 0.10 level of significance.
O Yes
O No
Expert Solution
This question has been solved!
Explore an expertly crafted, step-by-step solution for a thorough understanding of key concepts.

This is a popular solution!

Trending now
This is a popular solution!

Step by step
Solved in 2 steps with 3 images

Recommended textbooks for you
Linear Algebra: A Modern Introduction
Algebra
ISBN:
9781285463247
Author:
David Poole
Publisher:
Cengage Learning

Linear Algebra: A Modern Introduction
Algebra
ISBN:
9781285463247
Author:
David Poole
Publisher:
Cengage Learning