Marital Status More people are staying single longer in the United States. The following table gives the percent of never- married adults, age 15 and over, by gender, for the years 1995 and 2013. The growth has been approximately linear. Source: U.S. Census. Year Males Females 1995 31.0 23.5 2013 34.4 28.6 (a) Find a linear function, m(t), for the percent of never-maried males in terms of t, the number of years since 1990. (b) Determine the rate of change for the percent of never- married males. (c) Find a linear function, f(t), for the percent of never-married females in terms of t, the number of years since 1990. (d) Determine the rate of change for the percent of never- married females. (e) Use the results from parts (a) and (c) to estimate the percent of never-married males and females in 2015.
Marital Status More people are staying single longer in the United States. The following table gives the percent of never- married adults, age 15 and over, by gender, for the years 1995 and 2013. The growth has been approximately linear. Source: U.S. Census. Year Males Females 1995 31.0 23.5 2013 34.4 28.6 (a) Find a linear function, m(t), for the percent of never-maried males in terms of t, the number of years since 1990. (b) Determine the rate of change for the percent of never- married males. (c) Find a linear function, f(t), for the percent of never-married females in terms of t, the number of years since 1990. (d) Determine the rate of change for the percent of never- married females. (e) Use the results from parts (a) and (c) to estimate the percent of never-married males and females in 2015.

Functions and Change: A Modeling Approach to College Algebra (MindTap Course List)
6th Edition
ISBN:9781337111348
Author:Bruce Crauder, Benny Evans, Alan Noell
Publisher:Bruce Crauder, Benny Evans, Alan Noell
Chapter3: Straight Lines And Linear Functions
Section3.3: Modeling Data With Linear Functions
Problem 23E: When Date Are Unevenly speed. If data are evenly spaced, we need only calculate differences to see...

Related questions
Question
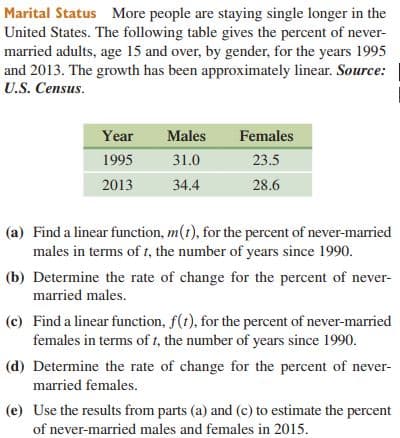
Transcribed Image Text:Marital Status More people are staying single longer in the
United States. The following table gives the percent of never-
married adults, age 15 and over, by gender, for the years 1995
and 2013. The growth has been approximately linear. Source:
U.S. Census.
Year
Males
Females
1995
31.0
23.5
2013
34.4
28.6
(a) Find a linear function, m(t), for the percent of never-maried
males in terms of t, the number of years since 1990.
(b) Determine the rate of change for the percent of never-
married males.
(c) Find a linear function, f(t), for the percent of never-married
females in terms of t, the number of years since 1990.
(d) Determine the rate of change for the percent of never-
married females.
(e) Use the results from parts (a) and (c) to estimate the percent
of never-married males and females in 2015.
Expert Solution
This question has been solved!
Explore an expertly crafted, step-by-step solution for a thorough understanding of key concepts.

Step by step
Solved in 5 steps

Recommended textbooks for you
Functions and Change: A Modeling Approach to Coll…
Algebra
ISBN:
9781337111348
Author:
Bruce Crauder, Benny Evans, Alan Noell
Publisher:
Cengage Learning

Algebra & Trigonometry with Analytic Geometry
Algebra
ISBN:
9781133382119
Author:
Swokowski
Publisher:
Cengage

Functions and Change: A Modeling Approach to Coll…
Algebra
ISBN:
9781337111348
Author:
Bruce Crauder, Benny Evans, Alan Noell
Publisher:
Cengage Learning
Algebra & Trigonometry with Analytic Geometry
Algebra
ISBN:
9781133382119
Author:
Swokowski
Publisher:
Cengage