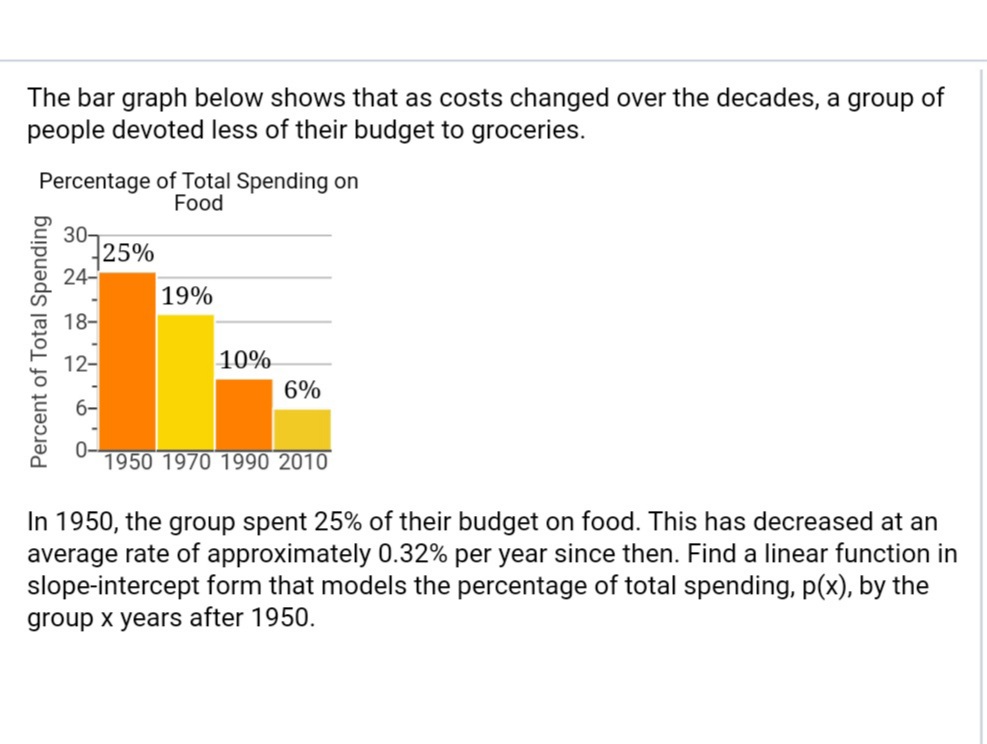
The bar graph below shows that as costs changed over the decades, a group of people devoted less of their budget to groceries. Percentage of Total Spending on Food 30- 25% 24- 19% 18- 12- 10% 6% 6- 1950 1970 1990 2010 In 1950, the group spent 25% of their budget on food. This has decreased at an average rate of approximately 0.32% per year since then. Find a linear function in slope-intercept form that models the percentage of total spending, p(x), by the group x years after 1950. Percent of Total Spending


Unitary Method
The word “unitary” comes from the word “unit”, which means a single and complete entity. In this method, we find the value of a unit product from the given number of products, and then we solve for the other number of products.
Speed, Time, and Distance
Imagine you and 3 of your friends are planning to go to the playground at 6 in the evening. Your house is one mile away from the playground and one of your friends named Jim must start at 5 pm to reach the playground by walk. The other two friends are 3 miles away.
Profit and Loss
The amount earned or lost on the sale of one or more items is referred to as the profit or loss on that item.
Units and Measurements
Measurements and comparisons are the foundation of science and engineering. We, therefore, need rules that tell us how things are measured and compared. For these measurements and comparisons, we perform certain experiments, and we will need the experiments to set up the devices.
In 1950, the group spent
of their budget on food. This has decreased at an average rate of approximately
per year since then. Find a linear function in slope-intercept form that models the percentage of total spending, p(x), by the group x years after 1950.
From the graph, we can conclude that the average rate is decreasing (negative sign) approximately 0.32 % per year, so the slope is m = - 0.32
The equation in slope-intercept form, that model the percentage of total spendings p(x) by American x years after 1950 is:
p(x) = mx + b
Substituting m = -0.32,
We have:
p(x) = - 0.32x + b

Trending now
This is a popular solution!

Step by step
Solved in 2 steps


