Math 11 Elementary Statistics In Class 3.3 Measures of Position (or location) Name Date Example 1: Computing and interpreting z- Scores A National Center for Health Statistics study states that the mean height for adult men in the United States is u = 69.4 inches, with a standard deviation of o = 3.1 inches. The mean height for adult women is u = 63.8 inches, with a standard deviation of o = 2.8 inches. Who is taller relative to their gender, a man 73 inches tall, or a woman 68 inches tall? Work through this problem in steps: The man's height is X = The men's mean is = The men's standard deviation is The man's z-score is z = (x - p)/o = ( _- So standard deviations from the mean Zman = The woman's height is x = The women's mean is The women's standard deviation is The woman's z-score is z = (x - p)/o = (___- standard deviations from the mean So Zwoman %3D Which one is larger? Example 2: 0.00, 0.08, 0.13, 0.14, 0.16, 0.17, 0.20, 0.29, .056, 0.70, 0.79 L = .25(11) = 2.75 which rounds to 3, so the 3rd number is the 25th percentile and its value is L = .50(11) = 5.5 which rounds to 6, so the 6th number is the 50th percentile, or the median and its value is L = .75(11) = 8.25 which rounds to 9, so the 9th number is the 75th
Math 11 Elementary Statistics In Class 3.3 Measures of Position (or location) Name Date Example 1: Computing and interpreting z- Scores A National Center for Health Statistics study states that the mean height for adult men in the United States is u = 69.4 inches, with a standard deviation of o = 3.1 inches. The mean height for adult women is u = 63.8 inches, with a standard deviation of o = 2.8 inches. Who is taller relative to their gender, a man 73 inches tall, or a woman 68 inches tall? Work through this problem in steps: The man's height is X = The men's mean is = The men's standard deviation is The man's z-score is z = (x - p)/o = ( _- So standard deviations from the mean Zman = The woman's height is x = The women's mean is The women's standard deviation is The woman's z-score is z = (x - p)/o = (___- standard deviations from the mean So Zwoman %3D Which one is larger? Example 2: 0.00, 0.08, 0.13, 0.14, 0.16, 0.17, 0.20, 0.29, .056, 0.70, 0.79 L = .25(11) = 2.75 which rounds to 3, so the 3rd number is the 25th percentile and its value is L = .50(11) = 5.5 which rounds to 6, so the 6th number is the 50th percentile, or the median and its value is L = .75(11) = 8.25 which rounds to 9, so the 9th number is the 75th

Big Ideas Math A Bridge To Success Algebra 1: Student Edition 2015
1st Edition
ISBN:9781680331141
Author:HOUGHTON MIFFLIN HARCOURT
Publisher:HOUGHTON MIFFLIN HARCOURT
Chapter11: Data Analysis And Displays
Section11.3: Shapes Of Distributions
Problem 20E

Related questions
Topic Video
Question
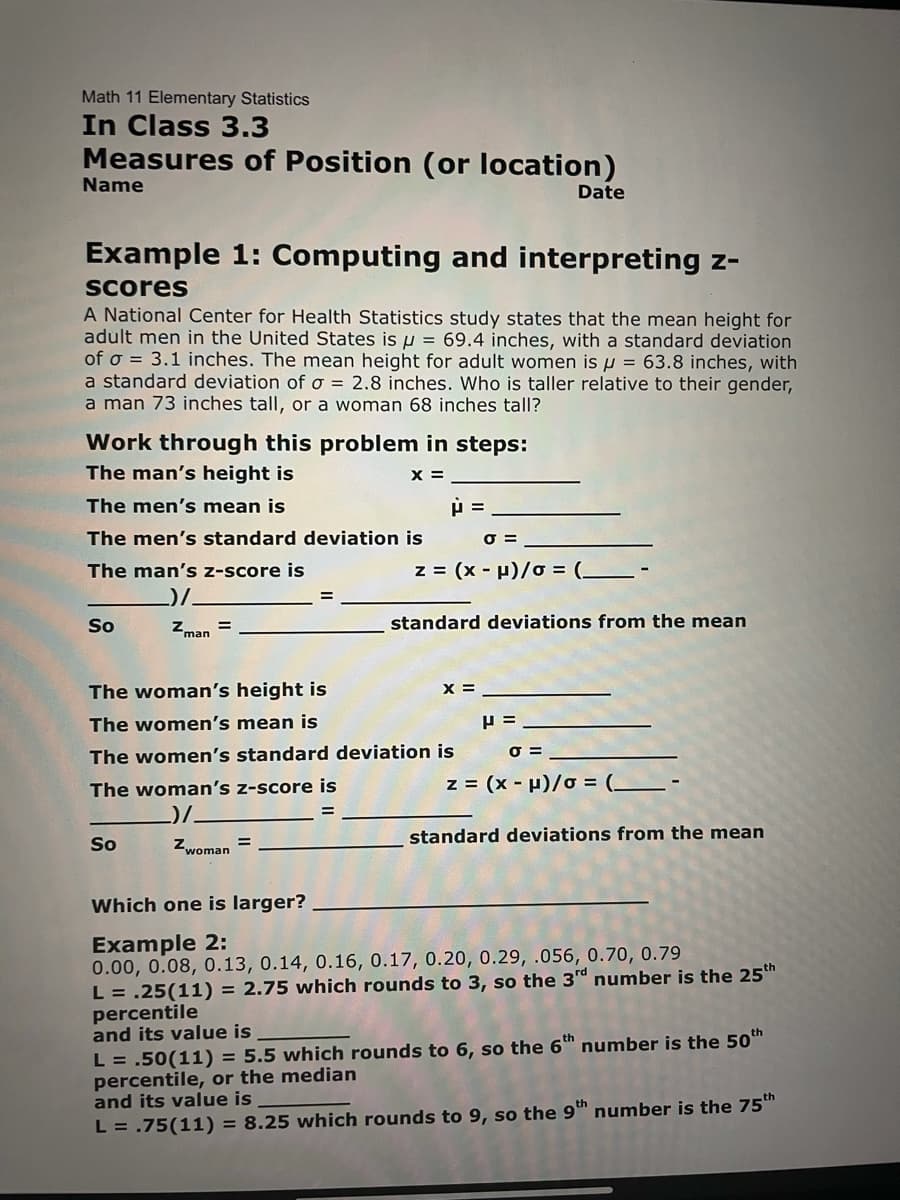
Transcribed Image Text:Math 11 Elementary Statistics
In Class 3.3
Measures of Position (or location)
Name
Date
Example 1: Computing and interpreting z-
Scores
A National Center for Health Statistics study states that the mean height for
adult men in the United States is u = 69.4 inches, with a standard deviation
of o = 3.1 inches. The mean height for adult women is u = 63.8 inches, with
a standard deviation of o = 2.8 inches. Who is taller relative to their gender,
a man 73 inches tall, or a woman 68 inches tall?
Work through this problem in steps:
The man's height is
X =
The men's mean is
The men's standard deviation is
O =
The man's z-score is
z = (x - p)/o = (__-
So
Zman
standard deviations from the mean
The woman's height is
X =
The women's mean is
The women's standard deviation is
O =
The woman's z-score is
z = (x - p)/o = (_
standard deviations from the mean
So
%3D
Zwoman
Which one is larger?
Example 2:
0.00, 0.08, 0.13, 0.14, 0.16, 0.17, 0.20, 0.29, .056, 0.70, 0.79
L = .25(11) = 2.75 which rounds to 3, so the 3rd number is the 25th
percentile
and its value is
L = .50(11) = 5.5 which rounds to 6, so the 6th number is the 50th
percentile, or the median
and its value is
L = .75(11) = 8.25 which rounds to 9, so the 9th number is the 75h
![percentile
and its value is
Example 3: Use the same data, from example 2.
L = .60(11) = 6.6 which rounds to 7, so the 7th number is the 60th
percentile
and its value is
Example 4: Use the same data, from example 2.
Find the percentile of 0.29
There are 7 values less than 0.29
The percentile = 100[(7 + 0.5)/11] = 68.18 or 68.2
So the result 0.29 corresponds to the 68" percentile.
Example 5: complete the table.
Use the same data, from example 2.
Min. Q, Q2 or Med Q, Max
Please use a copy of the text read to and complete the in-class assignment.
You may work on this page or use your own lined paper or graph paper in
you prefer.
In class assignment, problems: 11, 13, 17, 21 and 25
In Exercises 9-12, fill in each blank with the appropriate
word or phrase.
11The quantity Q - Q, is known as the
In Exercises 13-16, determine whether the statement is
true or false. If the statement is false, rewrite it as a true
statement.
13The third quartile, Q3, separates the lowest 25% of the data from the
12 of 14](/v2/_next/image?url=https%3A%2F%2Fcontent.bartleby.com%2Fqna-images%2Fquestion%2F87e7ed97-c167-45cc-b510-5bd999d5e24d%2F361dca08-8432-452b-b92e-b40641ef2392%2Fljo60hw_processed.jpeg&w=3840&q=75)
Transcribed Image Text:percentile
and its value is
Example 3: Use the same data, from example 2.
L = .60(11) = 6.6 which rounds to 7, so the 7th number is the 60th
percentile
and its value is
Example 4: Use the same data, from example 2.
Find the percentile of 0.29
There are 7 values less than 0.29
The percentile = 100[(7 + 0.5)/11] = 68.18 or 68.2
So the result 0.29 corresponds to the 68" percentile.
Example 5: complete the table.
Use the same data, from example 2.
Min. Q, Q2 or Med Q, Max
Please use a copy of the text read to and complete the in-class assignment.
You may work on this page or use your own lined paper or graph paper in
you prefer.
In class assignment, problems: 11, 13, 17, 21 and 25
In Exercises 9-12, fill in each blank with the appropriate
word or phrase.
11The quantity Q - Q, is known as the
In Exercises 13-16, determine whether the statement is
true or false. If the statement is false, rewrite it as a true
statement.
13The third quartile, Q3, separates the lowest 25% of the data from the
12 of 14
Expert Solution
This question has been solved!
Explore an expertly crafted, step-by-step solution for a thorough understanding of key concepts.

This is a popular solution!

Trending now
This is a popular solution!

Step by step
Solved in 2 steps

Knowledge Booster


Learn more about
Need a deep-dive on the concept behind this application? Look no further. Learn more about this topic, statistics and related others by exploring similar questions and additional content below.Recommended textbooks for you
Big Ideas Math A Bridge To Success Algebra 1: Stu…
Algebra
ISBN:
9781680331141
Author:
HOUGHTON MIFFLIN HARCOURT
Publisher:
Houghton Mifflin Harcourt

Glencoe Algebra 1, Student Edition, 9780079039897…
Algebra
ISBN:
9780079039897
Author:
Carter
Publisher:
McGraw Hill
Big Ideas Math A Bridge To Success Algebra 1: Stu…
Algebra
ISBN:
9781680331141
Author:
HOUGHTON MIFFLIN HARCOURT
Publisher:
Houghton Mifflin Harcourt
Glencoe Algebra 1, Student Edition, 9780079039897…
Algebra
ISBN:
9780079039897
Author:
Carter
Publisher:
McGraw Hill